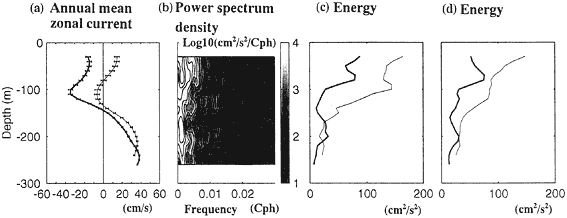
Figure 2Ѓ@(a) Vertical distribution of annual mean zonal current at 147Ѓ‹E. Averaging periods are from November 1995 through October 1996 (thick line) and from November 1996 through October 1997 (thin line). 95% confidence limit computed from sample standard deviation after applying a low pass filter of cutoff period at 25 hours is shown as horizontal bars. (b) Vertical distribution of logarithm of power spectrum density. Computation period is from November 1995 through October 1996. (c) Vertical profile of energy at 100 days to 30 days period band. The computation periods are the same as (a). (d) Same as (c) except it is for 30days to 2 days period band.
Ѓ@
3-4Ѓ@Power spectral density
Ѓ@
4Ѓ@Analysis
Ѓ@
In this section we restrict our attention to the variations observed before January, 1997 because we do not have consistent wind data after December 1996 at the time of writing of this manuscnpt.
Ѓ@
4-1Ѓ@Coherence between local wind and current
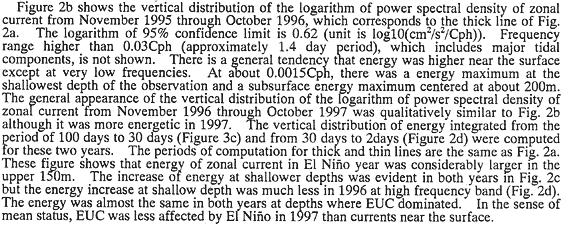
Plate 3a and b shows the vertical distribution of coherence and phase between zonal wind stress at 147.375Ѓ‹E, which is the closest point to 147Ѓ‹E, and zonal current at 147Ѓ‹E from November 1995 through October 1996. There were two frequency band where coherence was higher than 0.6. The lower band was at about semi-annual frequelncy and coherence had subsurface maximum centered at about 100m. The phase at this depth was about 180Ѓ‹. The other band was from the period of about 20 days to 80 days which included generally accepted frequency range of Madden-Julian Oscillation (Kessler et al., 1995). At this band coherence had multirple maxima. The phase at this band near the surface was close to 0Ѓ‹at the low frequency edge, and the amplitude of it increased almost linealy as the increase of frequency. The time lag corresponding to these phase lag was about 6 days at 30m. At about 175m, there was a weak maximum of coherence with positive phase lag.