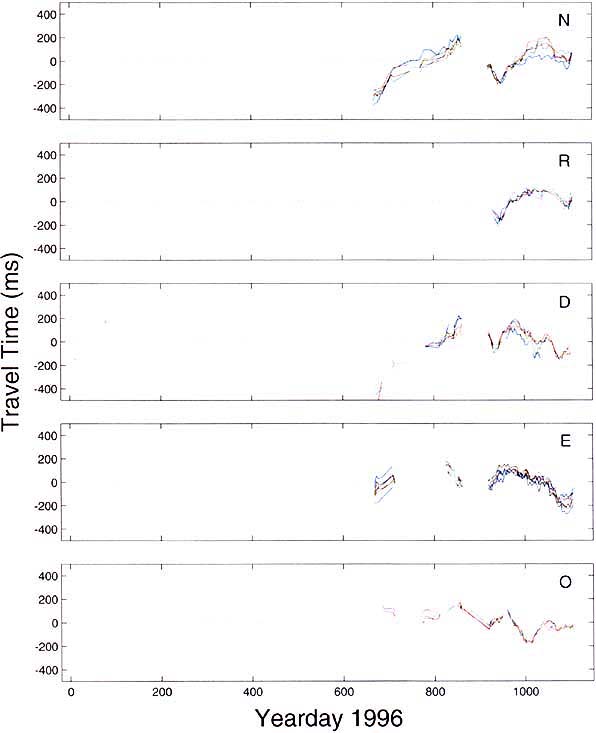
Figure 3. Travel time variability observed on the acoustic paths from the Kauai to various receivers as indicated. The data shown in Figure 2 and here are both for the region between California and Hawaii, yet the travel times from the Kauai acoustic source show much greater mesoscale variability.