The original receive FM signal and the compressed pulse signal is shown in the left of Fig. 11. The upper signal in the right of Fig. 11 is the zoom signal of the compress pulse signal while the lower one is calculated by BDRM theory. The correlation between the experiment signal and the computed signal is more than 0.85. This means:
Result(1) BDRM satisfies the request of computing the multipath structure in shallow water.
丂
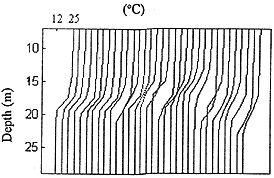
Fig. 12丂The measure data of the thermometer in the experiment
丂
Fig. 12 shows the measure data of the thermometer in the experiment. In the experiment the sound speed profile is measured every 10 minutes. The thermocline fluctuates with time in the picture.
丂
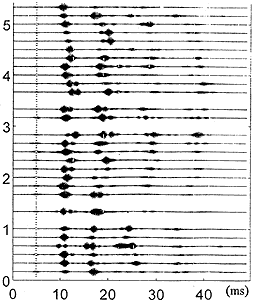
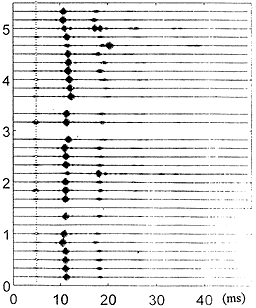
Fig. 13丂The compress pulsed signals fluctuate with the calculated signals
丂
Fig. 13 shows the multipath structure of the pulse, corresponding the thermometer data. The first is the experiment data while the second is the computed signals. Thus we have the result:
Result(2) The fluctuation of the thermocline coincides with the experiment signal, and also coincides with the computed signal.
丂
丂
丂
BACK丂丂丂CONTENTS丂丂丂NEXT
丂