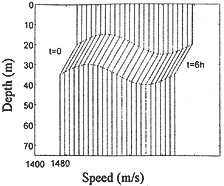
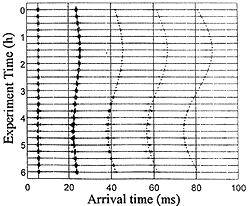
Fig. 9 fluctuation of the wave signal and the tide (numerical simulation)
In Fig. 9, the fluctuation tends of the wave signal and the tide coincide with each other. This means that it is possible to predict the fluctuation of the themocline by monitoring the propagation's multipath structures.
4.2 The experiment in Sep. 1997
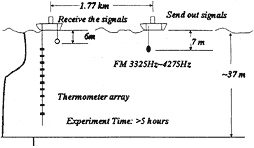
Fig. 10 Briefly description of the experiment in Sep 1997.
Fig. 10 describes the experiment in Sep. 1997. The depth of the sea is about 37m, while the thermocline variants from 10m to 25m in the water. The source is 3.8kHz, 950Hz wide band and is placed in 7m depth in water. The receiver is place in 1.77km long from the source and 6m depth in water. Here, the source and receiver are all above the thermocline. The source sends out signals for more than 5 hours. The length of each FM signal is about 10 minutes.
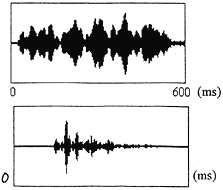
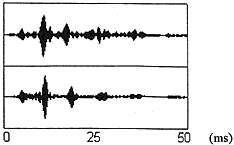
Fig. 11 The experiment signal and the calculated signal by BDRM
BACK CONTENTS NEXT