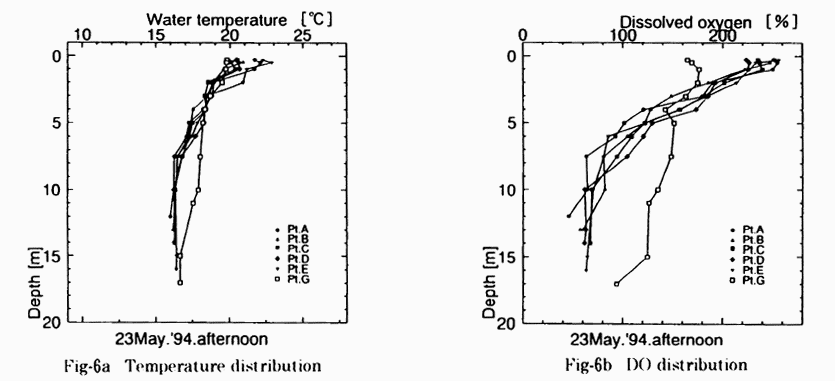
Fig-6 Vertical distributions of temperature and DO in sea area near the
reclaimed "Rokko island"

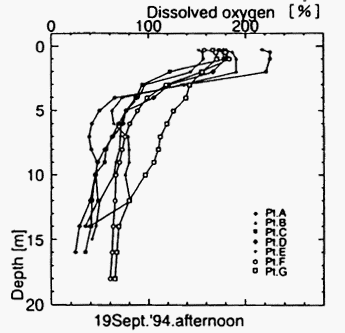
Fig-7 DO distribution measured near the Rokko-island in Sept. 1994

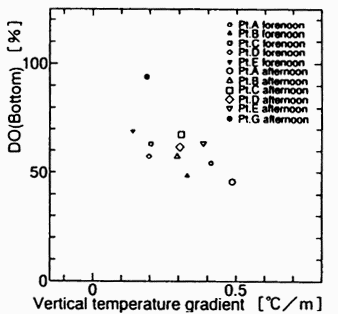
Fig-8 Influence of temperature gradient on DOin bottom layer
Table 1 Contents of filling materials of "Phoenix Plan" in
Osaka bay 8)
| |
海面面積
ha |
廃棄物の種類と量 1万m3 |
| 一般廃棄物 |
産業廃棄物 |
残土 |
浚渫土砂 |
合計 |
| 現在進行中 |
泉大津沖 |
20. |
390 |
900 |
470 |
470 |
3,000 |
| 尼崎沖 |
113 |
210 |
250 |
710 |
330 |
1,500 |
| 新規計画 |
大阪沖 |
95 |
460 |
740 |
300 |
- |
1,500 |
| 神戸沖 |
88 |
690 |
610 |
300 |
- |
1,500 |
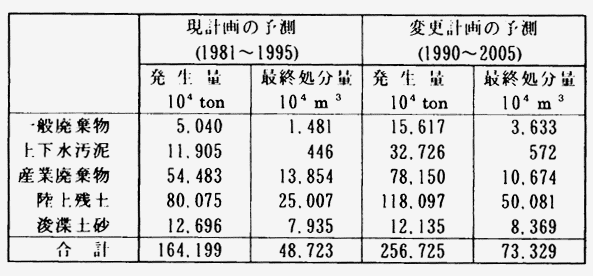
Table-2 Prediction of future amount of waste in Osaka bay area

前ページ 目次へ 次ページ