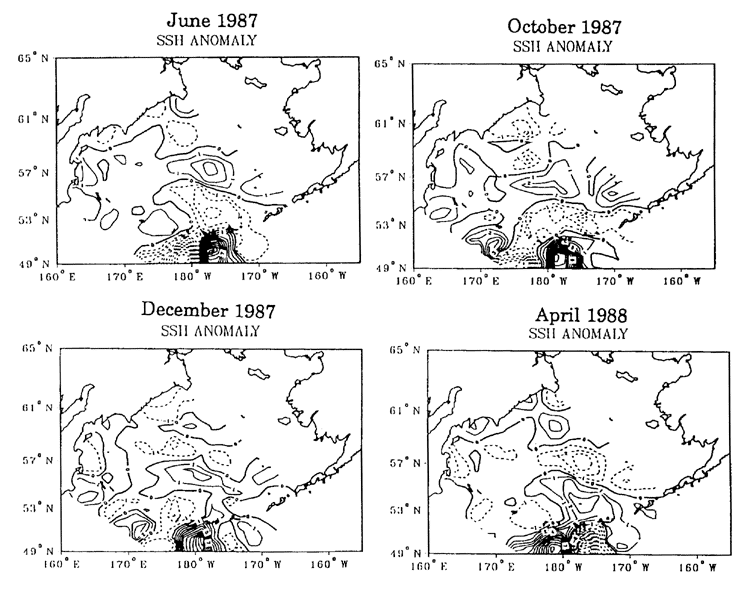
Figure 2 Sea Surface height anomaly field. The contour interval is 1cm (from Okkonen, 1996).

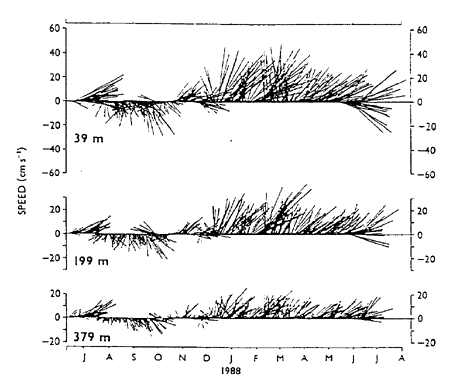
Figure 3 Daily net current vectors at the Amchitka Pass mooring (after use of 35h filter), 11 June 1987 - 12 June 1988. Up is north on the plots (from Reed, 1990).
BACK CONTENTS NEXT