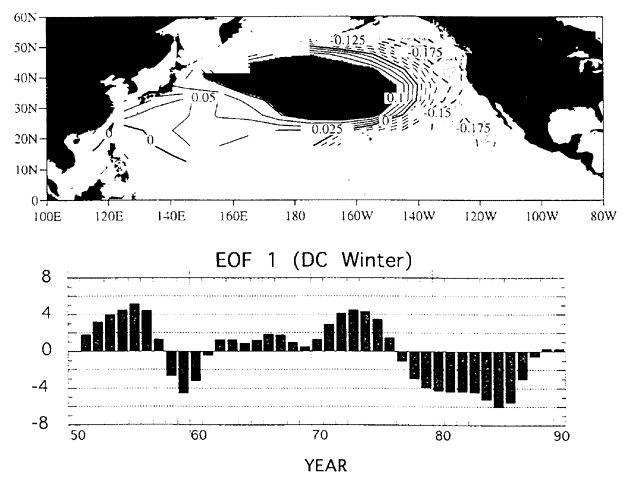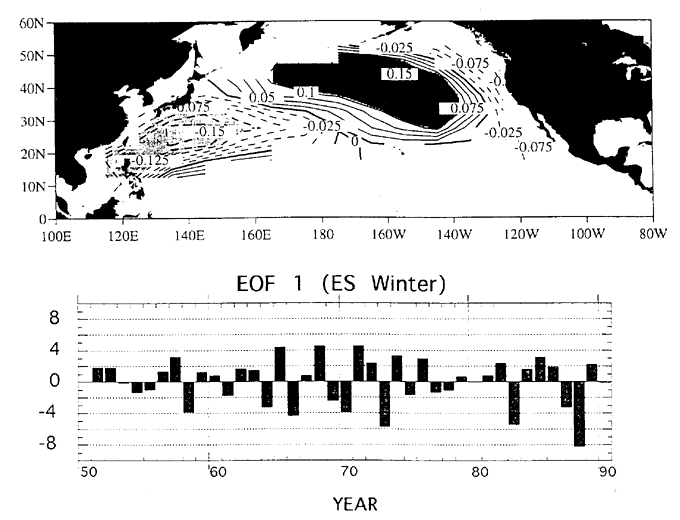
Fig. 1. Spatial pattern of the leading EOF for wintertime SST anomalies on DC time scale (longer than 60 months) in the North Pacific (upper panel) and its time coefficient (lower). This mode accounts for 35.6% for total variance of lowpass filtered wintertime anomalies. Contour interval is 0.02. Positive (negative) values are represented by solid (dashed) lines. After Tanimoto et al. (1996).

Fig. 2. Same as in Fig.1 but for the leading EOF for the ENSO time scale (24-60 months). This mode accounts for 26.5% for total variance of bandpass filtered wintertime anomalies. After Tanimoto et al. (1996).
BACK CONTENTS NEXT