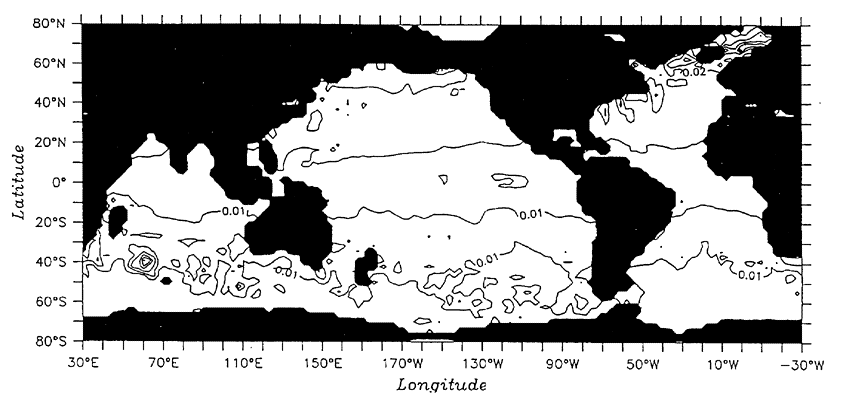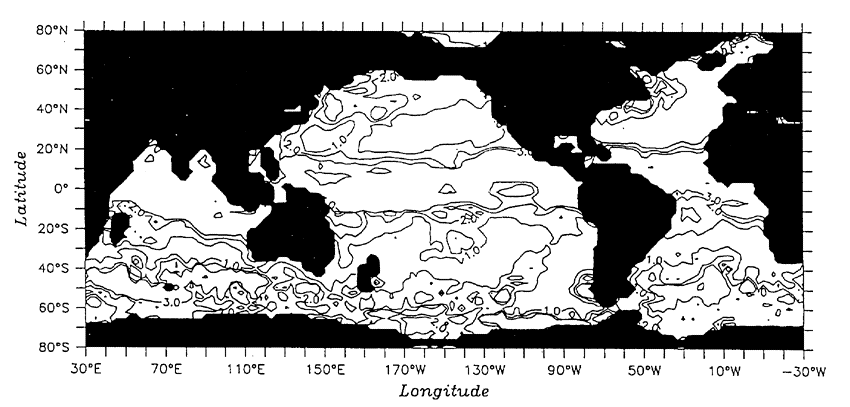
Fig.13 Standard deviation of sea surface level after 20 years integrtation of cycle-stationary ocean with monthly varying atmospheric heat and salt flux, annual averaged wind stress, and annual averaged turbulent kinetic energy.

Fig.14 Ratio between Figures 11 nad 12.
BACK CONTENTS NEXT