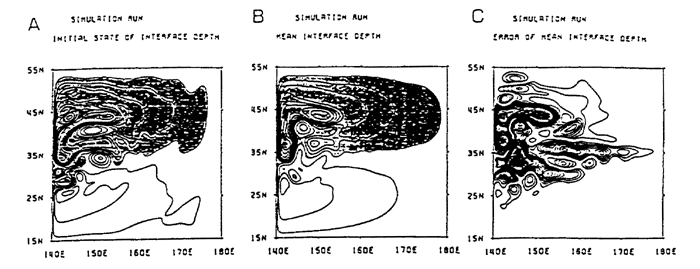
Figure 9. (a)The initial state of the interface depth field for assimilation runs and (b) error of the mean interface depth of the simulation run.
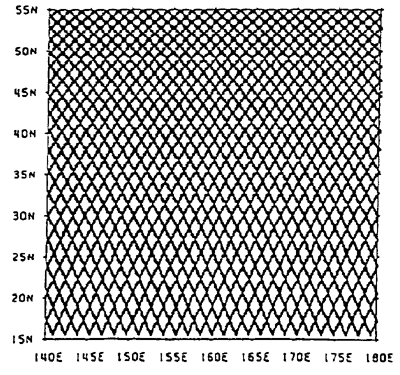
Figure 10. The assumed Geosat subtracks.
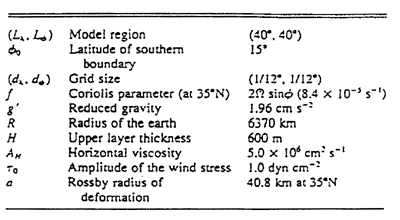
Table 1. Parameters in the numerical model.
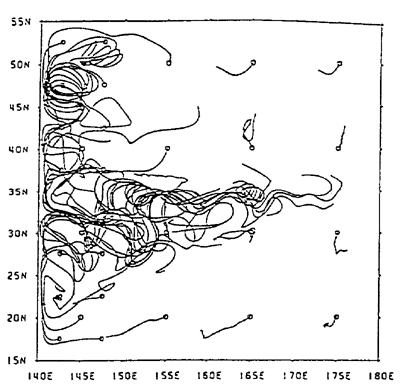
Figure 11. Spaghetti diagram of buoy trajectories.
Small circles indicate the initial points.
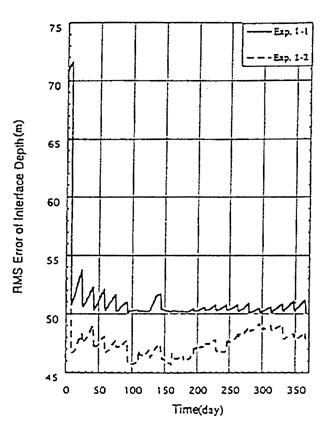
Figure 12. Time series of the rms errors for interface depth.
BACK CONTENTS NEXT