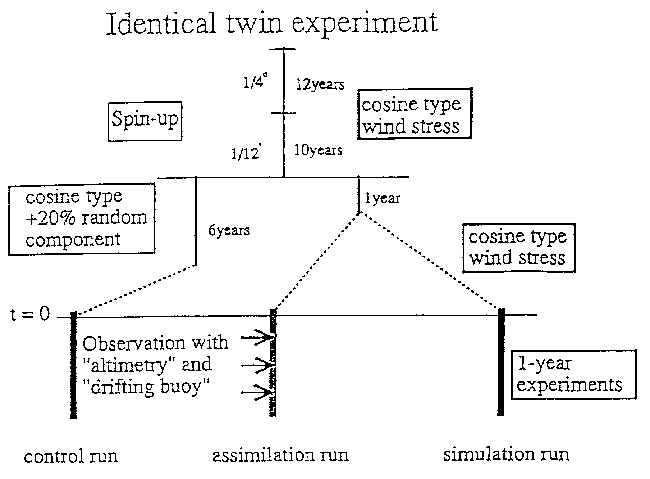
Figure 7. Schematic diagram of identical twin experiment.

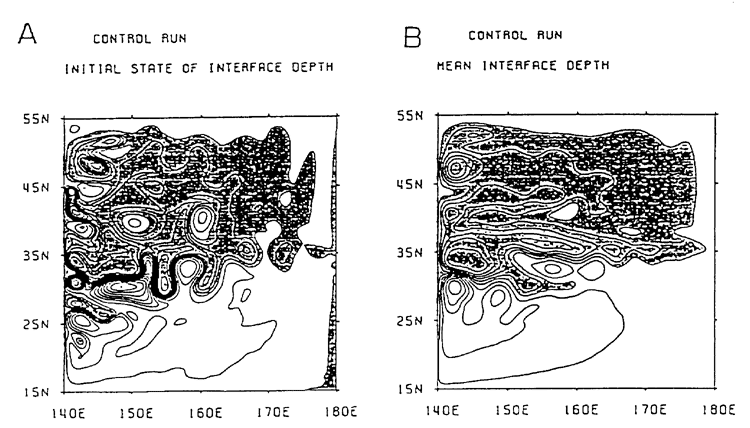
Figure 8. (a)The initial state of the interface depth field for and (b) mean interface depth of the control run. Contour interval is 50m and the shaded parts represent the region shallower than 600m.
BACK CONTENTS NEXT