|
REAL TIME PREDICTION OF PHYTOPLANKTON BLOOMS IN TANABE BAY
Yong Woo Park1 and Takao Yamashita2
1Department of Civil Engineering, Graduate School of Engineering
Kyoto University, Uji, JAPAN
ywpark@rcde.dpri.kyoto-u.ac.jp
2Disaster Prevention Research Institute
Kyoto University, Uji, JAPAN
ABSTRACT
In the ecosystem problem of the coastal area, important research subjects for coastal engineering are the monitoring system, the comprehensive environmental database and the development of prediction methods using observational data for the environmental condition. The Observation by Kyoto University and several research groups, to reveal the seawater exchange mechanism and phytoplankton dynamics for the red tide blooms in Tanabe Bay, was started in 1998. Real-time prediction for the variation of phytoplankton species was conducted by using the observation data in Tanabe Bay and the artificial neural network (ANN) in this study. We changed the ANN input data for finding the optimum, limited input data which are necessary for a real time estimate. It is found that ANNs is able to predict real-time variation of phytoplankton with temperature, salinity, solar radiation, air temperature, and precipitation, without nutrients and current information improve the prediction accuracy.
INTRODUCTION
In generally, forecasting/prediction models can be divided into statistical and physical based approaches. Statistical approaches determine relationships between historical data sets, whereas physical based approaches model the underlying physical processes directly. Among methods for ecosystem prediction, multivariate statistics and machine learning approaches are very useful and practicable modeling methods for coastal ecosystem. Both methods can derive not only the general but also particular characteristics from ocean/coastal observed data.
Several modeling approaches have been developed in order to gain understanding
on the dynamics of planktonic marine ecosystems. Probably, the most adopted approach was based upon a
compartmental structure, each compartment representing a tropic level or taxonomic group and the interactions
expressed by the different flows occurring among them. These models evolved from simple ones, only considering
nutrients-phytoplankton-zooplankton interactions (Steele, 1974), to more complex ones, where components
such as dissolved organic matter, detritus and bacteria are taken into account and size based models are
implemented ( Fasham et al., 1990; Moloney and Field,
1991).
Artificial Neural Networks (ANNs) are a practicable and useful method for predicting and elucidating information about ecology system, and the basic architecture of neural network can support the non-linear phenomenon. When using ANN for prediction, the modeling philosophy employed is similar to that used in traditional statistical approaches. The unknown model parameters (i.e., the connection weights in the case of ANN) are adjusted in order to obtain the best match between a historical set of model inputs and the corresponding outputs.
Observational data from several research group (DPRI, Kyoto Univ., Kinki Fishery Univ. and Tokyo Fishery Univ.) has started to reveal the seawater exchange mechanism and phytoplankton dynamics for the red tide blooms in Tanabe Bay, where the west boundary is located at the border of the Kii Channel and affected by Kuroshio currents (Fig.1). Observations were carried out at the Station 1 every day and at 25 stations approximately once a week during summer transition season since 1998. Vertical profile and horizontal distribution of temperature, salinity density, chlorophyll-a and dissolved oxygen were recorded at every station with CTD (Sea bird 25). Solar radiation, wind, air temperature, and the other meteorological factors were observed at the Storm surge Observation Tower, DPRI, Kyoto University and current profile (ADCP), wave (Ultra sonic wave meter) and the time series of the temperature measurements with depth of thermistor chain were carried out around the Observation Tower.
The aim of this research is to apply the artificial neural network method to the real-time prediction of the phytoplankton variations and to find the optimum data for a real-time prediction of red tide. Because the ecosystem (including phytoplankton blooms) characteristics are very complicated due to diverse environmental, changes, which control on the system, such as intrusion of low temperature and meteorological change, and other biological impacts.
| (Enlarge: 201KB) |
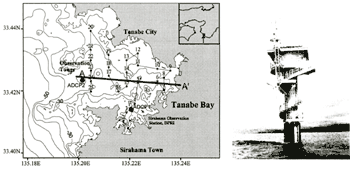 |
Figure 1. Study area and location of sampling stations: phytoplankton and
CTD are sampled at Station 1 and storm surge Observation Tower (vertical water temperature, current profile
(ADCP), solar radiation and wind around the mouth of Tanabe Bay
CHARACTERISTICS OF OBSERVED TIME SERIES DATA
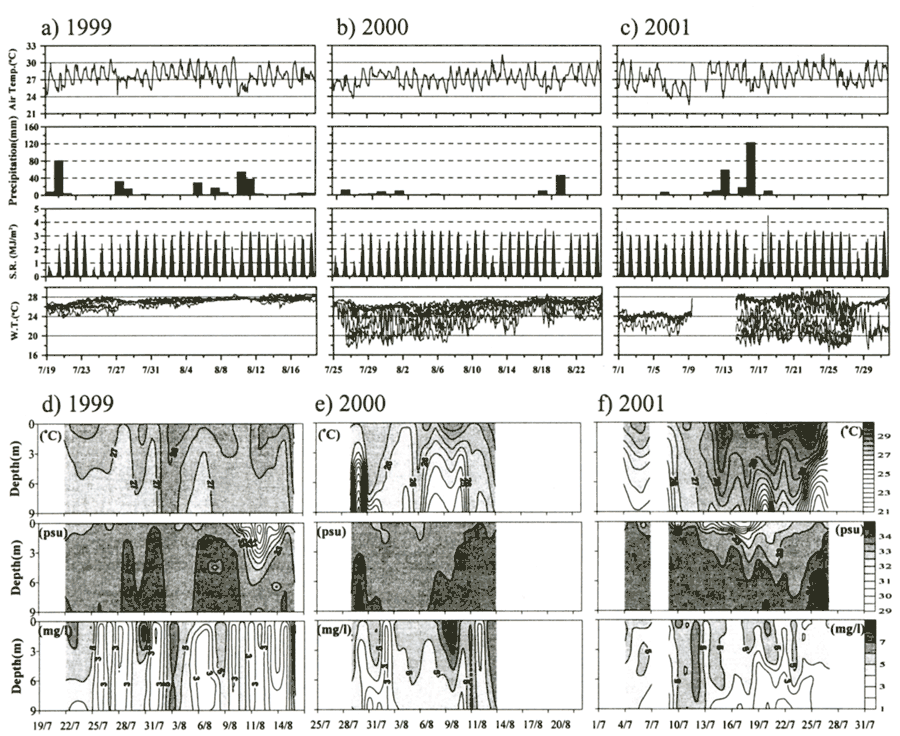
Figure 2 shows the observed time series data of air temperature, precipitation,
solar radiation and vertical time series water temperature at the bay mouth and interpolated vertical
distribution of water temperature, salinity and dissolved oxygen at the station 1. The fluctuation of
air temperature, solar radiation and sea surface temperature has a similar variation pattern. These seem
to have 10-day period. The stratification caused by water temperature appeared in 2000 and 2001, but did
not appear in 1999 (Figs. 2- a, b, c). Time-depth distribution of temperature, salinity and dissolved
oxygen at station 1 are presented in Figures 2-d, e and f. The salinity structure show relatively stable,
but the precipitation significantly influenced salinity of the surface waters. The low concentration of
dissolved oxygen appeared at bottom layer, but vertically constant by mixing mechanism in 1999. The relatively
low temperature waters (below 24℃ at 15 m in depth) coming from the Kii Channel had intruded through the
bay mouth. Open seawater intrusion and other environmental condition (air temperature, salinity and currents)
have affected the water exchange and phytoplankton bloom at Tanabe Bay in summer ( Yoshioka
et. al., 1998).
| (Enlarge: 163KB) |
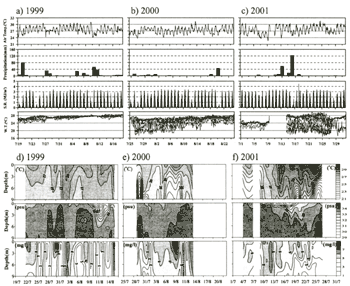 |
Figure 2. Time series of air temperature, precipitation, solar radiation
and water temperature (2.5 m, 5 m, 10 m, 15 m, 20 m, 25 m, 30 m below the depth) around the Observation
Tower, and time-depth distribution of temperature, salinity, and dissolved oxygen at station 1
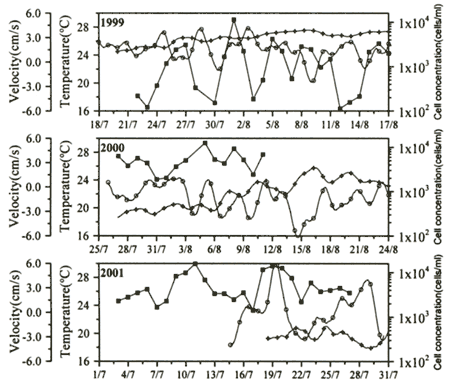
The original 20-minute interval current data and 1 hour interval temperature near the bay mouth were filtered by 49 hours low pass to remove the tidal components. The total phytoplankton cell concentration shows the periodic variation during observation period (Fig.3). The period of phytoplankton was approximately 4 days in 1999, 4-7 days in 2000 and 4-8 days in 2001. The east component of current and water temperature appeared in the similar pattern.
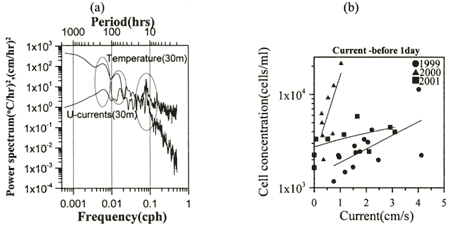
To know the accurate period of the temperature and current, we used the spectrum analysis. Two spectra were calculated via Blackman-Tukey's method with 8 degrees of freedom. Spectral estimates were smoothed using a Turkey window. The prominent long period of temperature and current appeared 3-4 days and 7-9days.
Figure 4-b shows the correlation between phytoplankton concentration at the bay head and before-1 day lag of east component of current at the bay mouth. This indicates that the slow inflow velocity makes weakly water exchange movement and causes the phytoplankton bloom.
Figure 3. 49 hours low pass filtered water temperature (+), the east component
of current (○) at the depth of 30 m around the bay mouth, and total phytoplankton concentration (■) in
1999, 2000, 2001.
Figure 4. Power spectrum of temperature and the east component of current
at the depth of 30 m (a). Correlation between phytoplankton cell concentration at the bay head and before-1
day lag of east component of current at the bay mouth (b)
Figures 2, 3, and 4 show that coastal time-series data is composed of a deterministic and a random component. The deterministic component changes over time in a regular and predictable way, caused by an underlying process. It can be characterized by a trend, periodicity and serial dependency. The random component is superimposed on the deterministic component and can be characterized by short-term fluctuations. Nature can be truly random or chaotic. Truly random components, such as the level of water, can be characterized by the statistical distribution function. Chaotic components of a time series are characterized by values that appear to be randomly distributed and non-periodic but are the result of a deterministic process due to underlying nonlinear dynamics (Recknagel, 1997).
|