|
RESULT AND DISCUSSION IN A TIME DOMAIN ANALYSIS
Results of the time history response analysis of floating unit
Motions of the floating unit
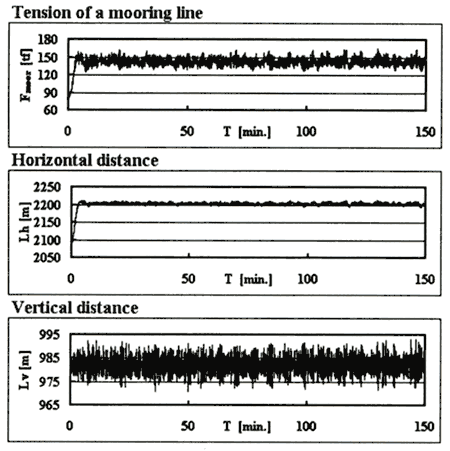
Figure 12 shows the results of time history of motions of a floating unit. About calculation condition, the significant wave height is 15 m and the mean wind velocity is 50m/s. That is to say the environmental condition is Survival state.
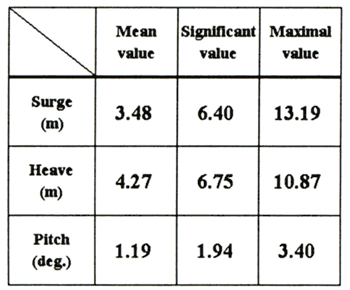
According to Figure 12, sequentially from the top, Surging motion, Heaving motion, and Pitching motion are shown. Table 3 shows a result of statistics analysis at these time series. The value is positive semi amplitude in time series. Figure 12 and Table 3, first of all, time series of surging motion shows that the floating unit moves in the flow direction 150 m and is oscillating with the significant value of 6.4 m in the surging direction in the position. Time series of heaving motion shows that the floating unit is oscillating with the significant value of 6.75m in the vertical direction in the position. Finally, time series of pitching motion shows that the floating unit is oscillating with the significant value of 1.94 (deg.) at the pitching direction in the position. Therefore, maximum positive semi amplitude of a pitching motion in time series is 3.4 degrees.
Tension acting a mooring line
Figure 13 shows the results of time history of tension acting on a mooring line. Sequentially from the top, the time series are shown in terms of next their parameters; the tension acting on the mooring lines, the horizontal distance from an anchor point to a mooring point and the vertical distance from the seabed to a mooring point.
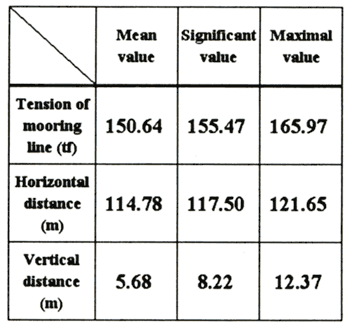
Table 4 illustrates as a result of statistics analysis at these time series. These values are positive semi amplitude in time series. Table 4 is the result of statistics analysis at the time series of tension of a mooring line. Sequentially from the left, the value that the mean value of positive semi amplitude is added to the mean value of time series, the value that the significant value of positive semi amplitude is added to the mean value of time series and the value that the maximum value of positive semi amplitude is added to the mean value of time series.
From these results, it turns out that the tension acting on one mooring line is about 160tf at the maximum, and it is much less than the rapture load, 950tf, of one mooring line. That means the maximum tension acting on one mooring line is about 17% of a rapture load. Second, this is the result of statistics analysis of the time series of the horizontal distance from an anchor point to a mooring point. When the offshore floating unit is in the state of stillness, this distance is 2,092 m. If it subtracts 2,092 m of distance in the state of stillness from 2,213 m of maximum distance, it set to about 121 m. This value indicates the maximum horizontal moving distance. Third, this is the result of statistics analysis of the time series of the vertical distance from the seabed to a mooring point. When the offshore floating unit is in the state of stillness, this distance is 981 m. If it subtracts 981 m of distance in the state of stillness from 993 m of maximum distance, it set to about 12 m. This value indicates the maximum vertical moving distance.
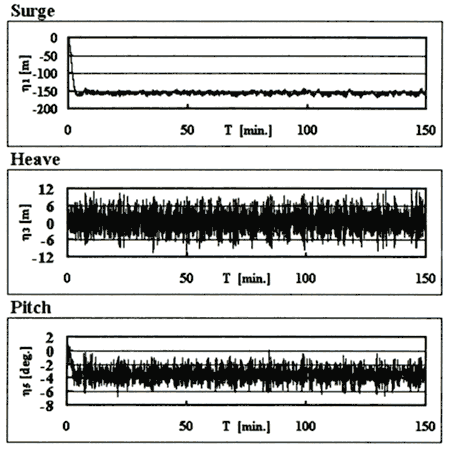 Figure 12. Time history of motions
Figure 13. Time history of tension of moored line
Table 3. Static analysis of motions
Table 4. Static analysis of mooring line
Results of displacement response analysis of riser
About the motion analysis of riser in the hang-off mode, the forced oscillation was given as the maximum motions of the offshore floating unit on the top of the riser. The analysis method of the riser motion the equation of motion of the riser is found by means of Finite Element Method. The external forces are found from Morison's equation. The equation of motion of the riser is written as follows.

Where, M shows the matrix of total mass of the riser, A shows the matrix of added mass, B shows the matrix of damping, C shows the matrix of restore force, K shows rigid matrix, η is displacement of motions of the riser. ρ shows the density of fluid, u and  show the matrix of the velocity and acceleration of water particle, respectively. ν shows the matrix of the flow velocity. D shows the outer diameter of the riser. C M and C D show the mass coefficient and the drag coefficient, respectively. Where the values of C M and C D are 2.0 and 1.17, respectively. The solution method of the equation of motion of the riser uses Runge-Kutta method-Gill Method.
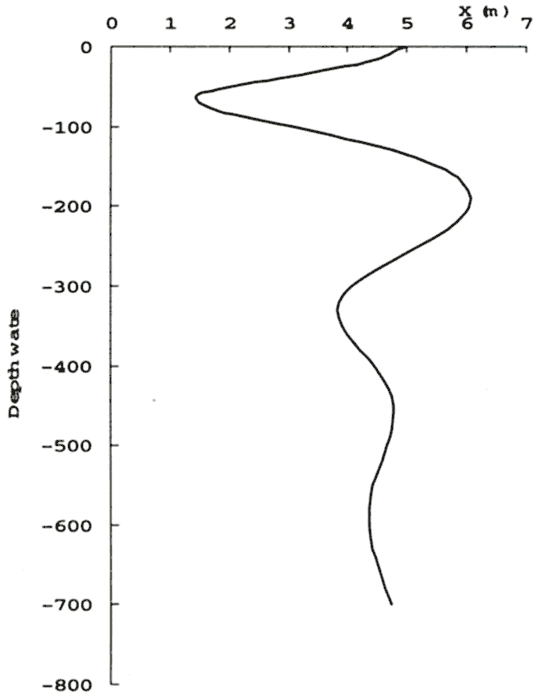
About the calculation, the forced oscillation on the top of riser was given as the motions of the offshore floating unit in wave. As a result of analysis, Riser is behavior in the range from 0.0m to 7.0m in the surging direction. The calculation results of riser motion are shown in the Figure 14. The breadth of floating unit is twenty-four meters. Then, the maximum displacement of riser motion is about 29% of breadth of floating unit. Therefore, the riser and the mooring lines are not entangled.
| (Enlarge: 10KB) |
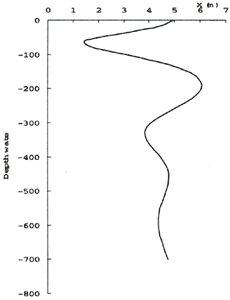 |
Figure 14. Calculated distributions of horizontal displacement of riser
CONCLUSIONS
As a result of the calculation of motions about the offshore floating unit for OTEC plant with riser in a time domain analysis in the sever environmental conditions of survival state aimed at the East China Sea, the following knowledge was acquired.
Maximum positive semi amplitude of a pitching motion in time series is 3.4 degrees. Therefore, since the behavior of floating unit is very small, the plant equipments for OTEC do not break down.
Maximum tension acting on one mooring line is about 17% of rapture load. Therefore, a mooring line is not damaged.
Maximum displacement of riser motion is about 29% of breadth of floating unit. Therefore, riser and mooring lines are not entangled.
Motion characteristic of the designed offshore floating unit for OTEC plant was able to obtain the very good calculation result. Therefore, in the present, designed offshore floating unit for OTEC with hanging-off riser has enough reality under the severe environmental conditions.
REFERENCES
Faltinsen, O.M., and F.C. Michelsen 1974. Motions of Large Structure in
waves at Zero Froude Number, Marine Vehicles.
Allan T., Maris, J., and Randolph Paulling. 1980. Analysis and Design of the
Cold-Water Pipe (CWP) for the OTEC System with Application to OTEC-1, Marine Technology, Vol.17,281-289
Ramsden, Harold D. 1983. Conversion of the USNS Chepachet to the OTEC-1 Platform,
Marine Technology, Vol.20,64-70
Kinelski, Eugene H. 1985. Ocean Thermal Energy Conversion Heat Exchangers:
A Review of Research and Development. Marine Technology, Vol.22,64-73
Hong, Sub. 1994. Three-Dimensional Static Analysis of Flexible Risers by a Lumped Mass Method, International Offshore and Polar Engineering Conference.
Hong, Sa Y. and Sup Hong. 1996. Motion Simulation of a Floating Structure Coupled with Mooring Lines, International Offshore and Polar Engineering Conference.
Tahar, A., Z. Ran, and M.H. Kim. 2002. Hull/mooring/Riser Coupled Spar Motion Analysis with Buoyancy-Can Effect, International Offshore and Polar Engineering Conference.
Kim, Y.B. and M.H. Kim. 2002. Hull/Mooring/Riser Coupled Dynamic Analysis of a Tanker-Based Turret-moored FPSO in Deep water, International Offshore and Polar Engineering Conference.
Bando, Akiyoshi, Koji Otsuka, and Yoshio Ikeda. 2002. Experimental Study of an 8-shaped Oscillating Flexible Riser, International Offshore and Polar Engineering Conference.
Zhang, Xinyu and Jun Zou. 2002. Coupled Effects of Risers/Supporting Guide Frames on Spar Responses, International Offshore and Polar Engineering Conference.
|