ANALYSIS OF RESULTS FOR ESTIMATING THE BENDING STIFFNESS
This section presents the procedure used for estimating the riser bending stiffness, as well as an analysis of the obtained results.
Procedure Used for Estimating the Bending Stiffness
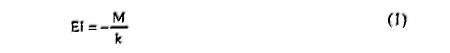
The relation between the bending moment (M) and the curvature (k) in any point of a beam is expressed by means of the following equation:
where EI is the beam bending stiffness.
The exact expression for the beam curvature k3is given by:
where v' and v"are, respectively, the first and second derivatives of the elastic curve, which were obtained through the 3rd degree functions fitted to the measured deformed configurations of the riser (see section "Tests for Obtaining Deformed Configurations").
The curvature was determined considering only reference measuring point no. 2 (see Figure 3). The reason is that this point is the nearest to the specimen fix end, thus presenting the greatest curvatures and therefore reducing the influence of measuring imprecision.
In order to calculate the bending moment, the following forces were taken into account: (i) force applied at the cable on side A (see Figure 1); (ii) force applied at the cable on side B(see Figure 1); (iii) weight of the riser head; (iv) weight of the masses fixed to the riser end (when it occurs) and (v) riser dead weight. Distances between the points of application of these forces and point no. 2 were calculated based on the functions fitted to the deformed configurations. It is important to emphasize that, since the specimen velocity was very low and almost constant, the inertial and damping forces acting on the structure were not considered.
Making use of the curvature values and the bending moment acting on point no. 2 for each position of the riser free end, some graphics correlating these two parameters were traced. Then, straight lines were fitted to the points of the graphics. As noted in Equation 1 , the angular coefficient of each of these straight lines represents an estimation for the riser bending stiffness (EI). It is worthy of note that this calculation was performed considering only the second loading stage described before, given that the first Stage Presented very small displacement variations, of the same order of that of the measuring precision.
Determination of Bending Stiffness
As described before, the determination of the bending stiffness of the riser requires the experimental evaluation of the applied bending moment and the corresponding curvature. By applying the procedures described on the latter section to the experimentally obtained results of the different quasi-static tests, plots of bending moment versus curvature were performed.
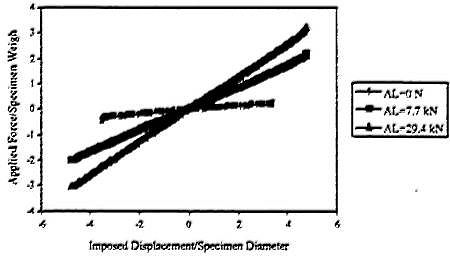
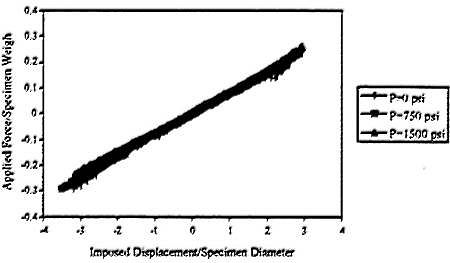
Figure 8 presents a comparison of resultant of applied forces (normalised) versus imposed displacements (normalised)graphic related to the second stage, for the cases with axial loading AL = 0.0, 17.7 e 29.4 kN and no internal pressure, while Figure 9 shows this same graphic for the cases with pressure P = 0, 750 e 1500 psi and no axial loading. Figure 8 indicates that as the axial loading increases the resultant of applied forces also increases, However, this does not mean that the stiffness increases, since one part of the resultant is related to the force necessary for lifting the masses. On the other hand, Figure 9 clearly shows that the bending stiffness does not change as the internal pressure increases.
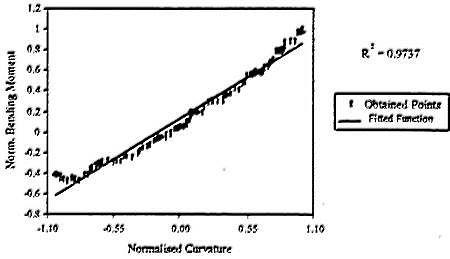
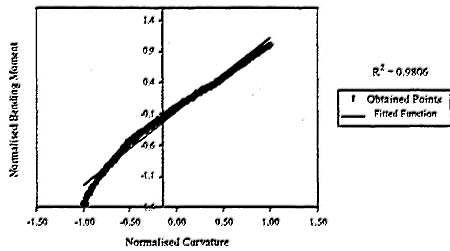
Figure 10 shows a plot of bending moment (normalised with respect to its maximum value) versus curvature (normalised with respect to its maximum value), for the case with no axial loading and no pressure. It can be seen that the points obtained through the experimental tests showed very rich tendency to be a straight line (correlation coefficient R2 = 0.97). The angular coefficient of this graphic (bending moment versus curvature)represents the bending stiffness related to the second stage.
Figure 8 - Comparison between Results Obtained through Quasi-static Tests for no Internal Pressure
Figure 9 - Comparison between Results Obtained through Quasi-static Tests for no Axial Loading
Figure 10 - Plot of Bending Moment (normalised) versus Curvature (normalised), using Data from Quasi-static Tests for no Axial Loading and no Pressure
This procedure was repeated for all test cases and the bending stiffness values obtained were nearly the same for the cases with no axial loading and with 750 psi and 1500 psi. This behaviour was expected because the imposed forces in the three cases were approximately the same (see Figure 9).
However, the procedure was not successful for the cases with axial loading, since the resultant moment necessary for bending the specimen is calculated through the summation of the portion due to the weight of the masses, to the riser dead weight and to the resultant of forces acting at the cables. As the axial loading was increased, the portion of the bending moment due to the weight of the masses and to the resultant of forces acting at the cables strongly increased too, with no increase in the resultant bending moment of the riser. Thus, the resultant bending moment is strongly affected by the lack of precision in measuring the forces applied to move the riser, since it was necessary to change the measurement scales of the forces acting at the cables.
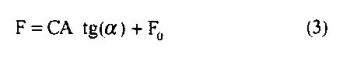
To estimate how the bending stiffness varies with the imposed axial loading, a simple model was considered (see Figure 11). The resultant of the forces that must be applied to move the riser free end can be given by the following equation:
where: AL - applied axial loading;
F0 - force that must be applied for bending the riser free end with no axial loading.
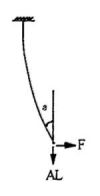
Figure 11 - Simplified Model Used
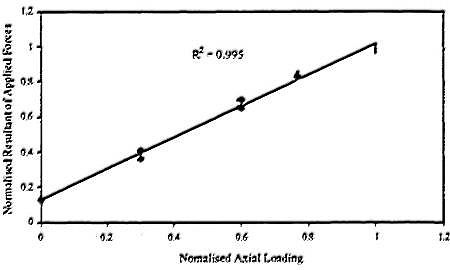
In order to verify the validity of this model, it has been plotted a graphic that correlates the resultant of the normalised applied forces (to impose a 0.50 m displacement to the free end)and the normalised axial loading, as Figure 12 shows. It is clearly seen in this figure that a straight line can be well fitted to the measured points. This straight line angle (

≈9
0) is very similar to the angle of inclination of the riser end, which was experimentally obtained (
≈10
O). Therefore, it has been concluded that the model was valid, and, by consequence, that the applied axial loading does not affect the riser stiffness.
The application of this procedure for determining the bending stiffness was not feasible for the first stage, since its displacement band is very small (see Figure 5). Nevertheless, this stiffness can be approximately estimated by considering the ratio between the apparent stiffnesses of the two stages. Thus, it has been concluded that the bending stiffness related to the first stage is approximately eight times greater than that of the second stage.
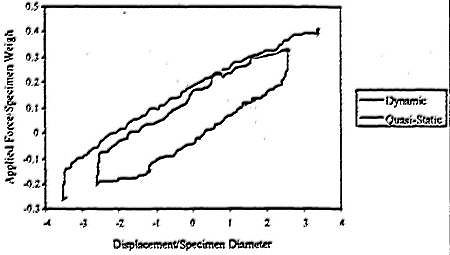
Figure 13 shows a typical comparison between the dynamic tests with constant velocity (quasi-static) and those with variable velocity (frequency = 15 Hz), through a plot of resultant of normalised applied forces versus normalised imposed displacement. It can be noted in this figure that the stiffnesses of the two types of tests are very similar, for both the first and the second stage. This fact indicates that the velocity of test does not affect the riser bending stiffness.
Aiming to check the eventual modifications on the specimen behaviour after all tests (total of 475), the first case of test (no pressure and no axial loading) was repeated. Figure 14 presents a plot of normalised bending moment variation versus normalised curvature for the final test. The bending stiffness(EI) value obtained is very near to that estimated through the first tests, which indicates that the specimen behaviour was not altered by the set of tests.
Figure 12 - Plot of Resultant of Applied Forces (normalised)versus Axial Loading (normalised), for no Pressure
Figure 13 - Comparison between Typical Results (normalised) of Quasi-static Tests and Dynamic Tests (f=0.05Hz), for no Axial Loading and no Pressure
Figure 14 - Plot of Bending Moment (normalised) versus Curvature (normalised), Obtained through the Final Test (Axial Loading=29.4 kN e no Pressure)