DESCRIPTION OF EXPERIMENTAL TESTS
The tests were carried out on a 4" internal diameter, 4 meters long riser specimen with a slight initial curvature. In order to verify the flexible riser behaviour, three types of tests were performed: tests for obtaining the deformed configurations and forced dynamic tests with constant velocity and with variable velocity.
Tests for Obtaining Deformed Configurations
In these tests, lateral displacements were imposed to the specimen free end. The extreme positions were ‐0.5 m and +0.5 m, referred to its undeformed position, and the displacement increment was 0.1 m. For each of these positions, all signals were acquired and the deformed configurations were estimated by measuring the distances between two fix points and each reference measuring point. Six reference measuring points along the riser specimen and two points of the connections of the cables were taken into account, as shown in Figure 3. In this figure, one can note points A and B, whose coordinates were previously measured to allow the calculation of the inclination of the cables. By making use of the measurements a and b and the fix points coordinates A1 and B1(see Figure 3), the desired coordinates were obtained through simple analytic geometry. The static deformed configurations were measured for estimating the position of each reference measuring point during the dynamic tests. This procedure was performed by correlating each of these measures with the displacement measured through the electric potentiometer.
Initially, points of the graphics correlating the Xi and Yi coordinates with imposed displacement were fitted to 1st and 2nd degree functions respectively, through the Least Squares Method. These functions allowed the determination of X and Y coordinates of the six reference measuring points, for any displacement imposed to the riser free end.
The final step for obtaining the riser elastic curve was to fit 3rd degree functions to the six reference measuring points, for each deformed configuration of the riser. These fitting functions presented high correlation coefficients, as it can be seen in Figure 4, which shows the deformed configuration of the extreme position of the riser, for the case with no axial loading and no pressure.
(拡大画面: 45 KB)
Figure 3 - Reference Measuring Points for Obtaining the Deformed Configurations
(拡大画面: 86 KB)
Figure 4 - Typical Fitting of 3rd Degree Functions to the Deformed Configurations (no Axial Loading and no Pressure)
The procedure described above was repeated for each test case, once it has been noted that, as axial loading and internal pressure were applied, small variations occurred on the specimen deformed configuration.
Dynamic Tests
In this section, dynamic tests with constant and variable velocity imposed to the specimen are described.
Dynamic Tests with Constant Velocity
The purpose of these tests was to estimate the specimen bending stiffness in different cases, allowing the investigation of how axial loading and internal pressure influence this property. A continuous displacement variation was imposed to the riser free end, with low and constant velocity, from the left extreme position (side A - see Figure 1) to the right extreme position (side B - see Figure 1). These quasistatic tests were repeated a few times for each test case, performing a total of 15 tests. Each case was a combination of an axial loading case (CA = 0; 8.8; 17.7; 22.6 e 29.4 kN) and an internal pressure case (P= 0; 750 e 1500 psi - obs: 1psi = 6.89 kPa).
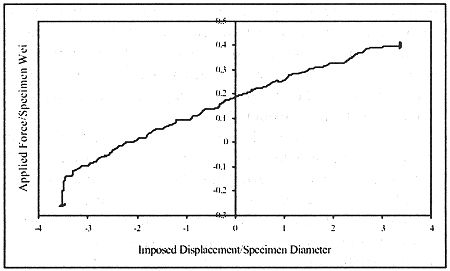
Figure 5 shows a plot of resultant of applied forces(normalised with respect to the specimen weight) versus imposed displacement (normalised with respect to the specimen external diameter), for the case with no axial loading and no internal pressure. It can be noted in this figure that the measured response presents two different stages2, which can be represented by straight lines. The first stage probably is related to the force necessary for overcoming the specimen internal friction. The second one is related to the force necessary for keeping the specimen in motion.
Figure 5 - Plot of Resultant of Applied Forces (normalised)versus Imposed Displacement (normalised), Obtained from the Quasi-static Test for no Axial Loading and no Pressure
Dynamic Tests with Variable Velocity
These tests had the goal of estimating the specimen damping ratio in several cases, verifying how axial Loading and internal pressure affect this property. Dynamic displacements were imposed to the riser free end by means of harmonic functions, varying their frequencies and amplitudes, always centred on the undeformed position of the riser free end.
The dynamic amplitudes imposed to the free end were around 0.2, 0.3, 0.5, 0.7 and 0.8 m, and the exciting frequencies were 0.05, 0.10, 0.15, 0.20 and 0.25 Hz. These situations were imposed for all cases of axial loading and internal pressure as mentioned before, resulting in a total of 475 different tests, which were carried out by using the developed control system.
After finishing these tests, all test cases of dynamic amplitudes and exciting frequencies were repeated, for no axial loading and no pressure. Thus, any significant alteration on the specimen behaviour could be detected (this did not happen).
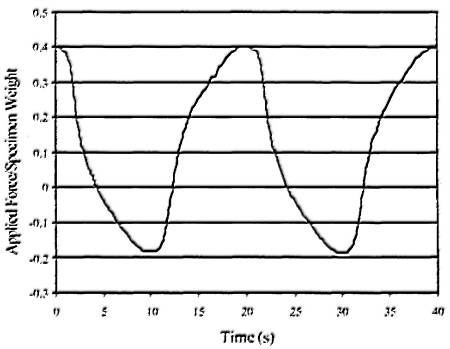
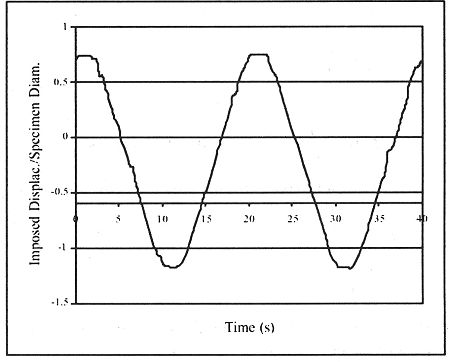
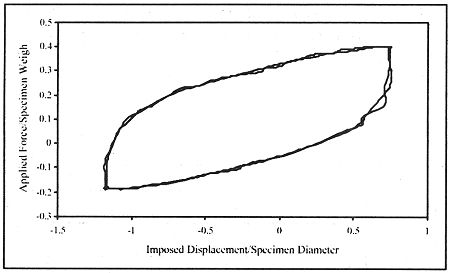
In order to illustrate a typical result, Figures 6.a and 6.b show, respectively, the resultant of applied forces (normalised with respect to the specimen weight) and the displacement of the specimen free end (normalised with respect to the riser external diameter) in time domain for the case of dynamic amplitude DA=0.2 m, exciting frequency EF=0.05 Hz, pressure P=1500 psi and no axial loading. Figure 7 shows a plot of normalised resultant of applied forces versus normalised displacement, for the same case of Figure 6. It is clear from these figures the high quality of the signals, suggesting high level of repeatibility between two cycles. As a result, an accurate estimation of the equivalent viscous damping ratio using the hysteresis cycles was possible. It can be also seen in Figure 7 the two stages described before, for both loading and unloading cases. In this latter case, a weak non-linear behaviour can be noted.
Figure 6 - Dynamic Test with Variable Velocity (DA =0.2m, EF=0.05 Hz, P=1500 psi e AL=0 kN).
Figure 6.a - Resultant of Applied Forces (normalised)
Figure 6.b- Imposed Displacement (normalised)
Figure 7 - Plot of Typical Response of Resultant of Applied Forces (normalised) versus Imposed Displacement (normalised)for Dynamic Tests with Variable Velocity (DA = 0.2 m, EF = 0.05 Hz,P=1500psi e AL-0 kN).