(その 1)
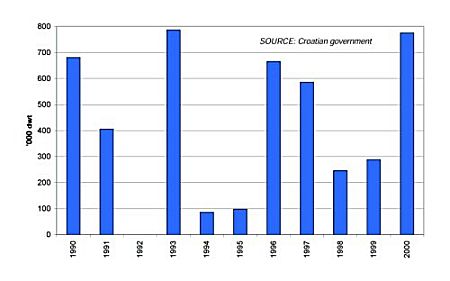
Croatian Shipbuilders: Newbuilding Contracts Received by Year 1990-2000
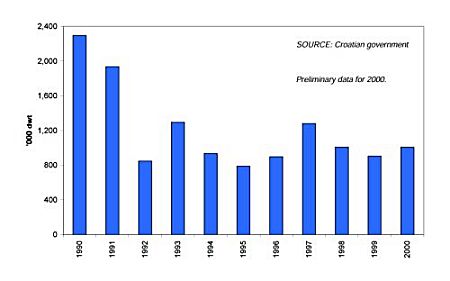
Croatian Shipbuilders: End-Year Orderbook 1990-2000
Croatia: Annual Newbuilding Orders Received 1990-2000
| |
Ships contracted in year |
End-year order-book |
| No. of ships |
000 dwt |
No. of ships |
000 dwt |
| 1990 |
18 |
680.7 |
47 |
2,295.6 |
| 1991 |
80 |
406.0 |
39 |
1,936.5 |
| 1992 |
- |
- |
21 |
848.5 |
| 1993 |
17 |
786.9 |
30 |
1,295.2 |
| 1994 |
2 |
85.7 |
22 |
935.4 |
| 1995 |
4 |
97.6 |
21 |
791.0 |
| 1996 |
20 |
665.4 |
26 |
896.7 |
| 1997 |
20 |
585.9 |
38 |
1,280.8 |
| 1998 |
5 |
246.0 |
30 |
1,009.2 |
| 1999 |
8 |
288.2 |
27 |
905.4 |
| 2000 |
21 |
775.5 |
25 |
1,008.1 |
Data in '000 gross tons.
SOURCE: Croatian government.
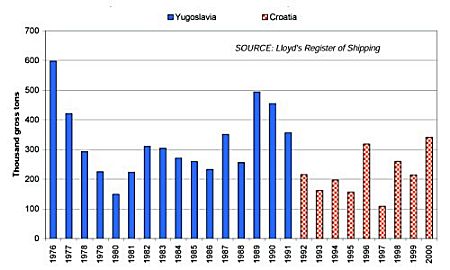
Yugoslavia & Croatia: Ship Completions by Year 1976-2000
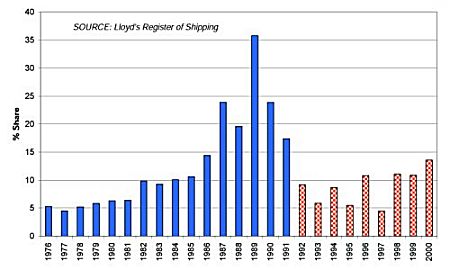
Yugoslavia & Croatia: % Share of European Completions 1976-2000
Yugoslavia and Croatia: Annual Ship Completions 1976-2000
| |
Yugoslavia |
Yugoslavia:
% Share of
Europe |
Croatia |
Croatia: %
Share of
Europe |
Total Europe |
Total World |
| 1976 |
597 |
5.3 |
|
|
11,308 |
33,922 |
| 1977 |
421 |
4.5 |
|
|
9,363 |
27,532 |
| 1978 |
293 |
5.2 |
|
|
5,632 |
18,194 |
| 1979 |
225 |
5.9 |
|
|
3,842 |
14,289 |
| 1980 |
149 |
6.3 |
|
|
2,366 |
13,101 |
| 1981 |
223 |
6.4 |
|
|
3,485 |
16,932 |
| 1982 |
311 |
9.8 |
|
|
3,170 |
16,820 |
| 1983 |
304 |
9.3 |
|
|
3,289 |
15,911 |
| 1984 |
271 |
10.1 |
|
|
2,686 |
18,334 |
| 1985 |
259 |
10.6 |
|
|
2,446 |
18,157 |
| 1986 |
233 |
14.4 |
|
|
1,618 |
16,845 |
| 1987 |
350 |
23.9 |
|
|
1,467 |
12,259 |
| 1988 |
256 |
19.6 |
|
|
1,306 |
10,704 |
| 1989 |
494 |
35.8 |
|
|
1,380 |
12,852 |
| 1990 |
455 |
23.9 |
|
|
1,904 |
15,707 |
| 1991 |
356 |
17.4 |
|
|
2,050 |
15,937 |
| 1992 |
|
|
215 |
9.2 |
2,347 |
18,254 |
| 1993 |
|
|
162 |
5.9 |
2,757 |
19,811 |
| 1994 |
|
|
197 |
8.7 |
2,277 |
17,907 |
| 1995 |
|
|
156 |
5.5 |
2,839 |
20,355 |
| 1996 |
|
|
318 |
10.8 |
2,948 |
24,187 |
| 1997 |
|
|
108 |
4.4 |
2,437 |
23,858 |
| 1998 |
|
|
259 |
11.1 |
2,348 |
23,592 |
| 1999 |
|
|
215 |
10.9 |
1,975 |
25,428 |
| 2000 |
|
|
341 |
13.6 |
2,512 |
32,651 |
Data in '000 gross tons.
SOURCE: Lloyd's Register "World Shipbuilding Statistics"
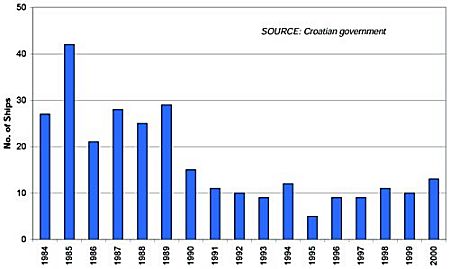
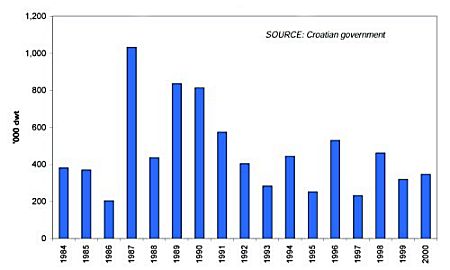
Croatian Shipbuilders: Newbuilding Deliveries by Year 1984-2000
Croatian Shipbuilders: Newbuilding Deliveries by Year 1984-2000
Croatia: Annual Newbuilding Deliveries 1984-2000
| |
No. of ships |
000 dwt |
|
| 1984 |
27 |
381.5 |
|
| 1985 |
42 |
369.6 |
|
| 1986 |
21 |
204.0 |
|
| 1987 |
28 |
1,032.8 |
|
| 1988 |
25 |
436.3 |
|
| 1989 |
29 |
836.2 |
|
| 1990 |
15 |
813.4 |
|
| 1991 |
11 |
574.2 |
|
| 1992 |
10 |
403.9 |
|
| 1993 |
9 |
283.3 |
|
| 1994 |
12 |
444.1 |
|
| 1995 |
5 |
252.0 |
|
| 1996 |
9 |
529.4 |
|
| 1997 |
9 |
231.6 |
|
| 1998 |
11 |
461.3 |
|
| 1999 |
10 |
319.1 |
|
| 2000 |
13 |
346.3 |
Preliminary |
SOURCE: Croatian government.
|
|