The results obtained up to now
9 The results of the continuous Nox monitoring field test are as follows:
| (1) |
Long term reliability of the sensor, accuracy of the sensor and practical necessary interval of calibration.
|
| |
Up to 6 months period, all items mentioned above are within a practical acceptable range.
|
| (2) |
Comparison of NOx value at shop test data and monitoring data. |
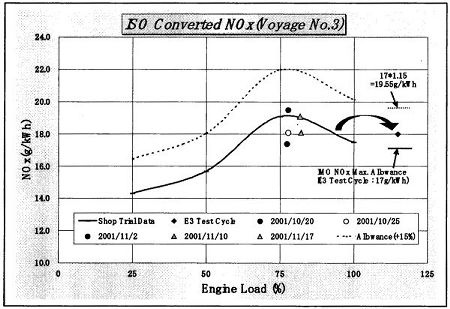
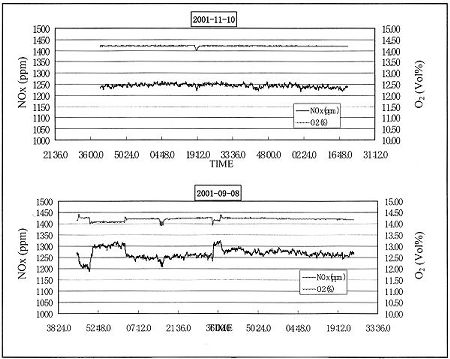
10 Fig. 7 shows the data obtained from "Ikomasan". As shown clearly, almost every data is distributed within the shop test figure. Fig.8 shows an example of monitoring records of 60minutes. The upper side shows at steady condition and lower side shows at load fluctuation condition.
Fig.7 Monitoring records from "Ikomasan"
Fig.8 An example of 60 minutes records "Ikomasan"
Relation between fuel properties and NOx from the engine
11 Table 4 shows the results of fuel analysis. So far, the nitrogen content in the fuel is distributed over a rather narrow range of between 0.3-0.4 %. There is no clear relation between nitrogen contents and generated NOx from the engine. We need more careful study.
Table 4 The results of analysis of used fuels
Vessel name
Bunker date |
Port Name |
Supplier Name |
Sample No |
Carbon |
Hydrogen |
Nitrogen |
Sulfur |
Oxygen |
| "IKOMASAN" |
|
|
|
|
|
|
|
| 24-Jun-2001 |
FUJAIRAH |
FAL |
F201010816 |
84.98 |
10.78 |
0.34 |
3.28 |
0.17 |
| 04-Aug-2001 |
FUJAIRAH |
OCEAN BUNK |
F201010817 |
84.84 |
11.25 |
0.39 |
3,05 |
0.19 |
| 18-Sep-2001 |
JEDDAH |
BAKRl |
F201012604 |
85.1 |
10.93 |
0.39 |
3.14 |
0.17 |
| 28-Oct-2001 |
FUJAIRAH |
UNKNOWN |
F201014487 |
85.09 |
11.16 |
0.38 |
3.12 |
0.19 |
| "NYK ANTARES" |
|
|
|
|
|
|
|
| 03-Aug-2001 |
SINGAPORE |
CONSORT |
F301012114 |
85.46 |
11.01 |
0.29 |
3.47 |
0.17 |
| 15-Oct-2001 |
ROTTERDAM |
SHELL |
F301013998 |
85.21 |
10.33 |
0.30 |
3.12 |
0.18 |
| "RR76NOxWG" |
|
|
|
|
|
|
|
| 15-Oct-2001 |
|
|
F301013123 |
|
|
0.387 |
4.3 |
|
12 If we find that the nitrogen content in fuels have bigger effects on NOx generated from the engine, it may be necessary to revise the "NOx Technical Code" to allow some adjustment by the amount of nitrogen content in the fuel or revise ISO821 7"Marine Fuel" to limit the nitrogen content in fuel.
Proposal to the evaluation criteria of NOx monitoring data
13 As shown in Fig.7, it seems that it is not appropriate to evaluate the monitoring data only by comparing with E3 mode data given at the shop test. Many shop test data shows that the NOx value at each engine load change widely by engine type, but the E3 mode NOx value is the same. So far, we believe it is more accurate to evaluate the monitoring data comparing with engine load base curve, which will be given at the shop test or sea trial.
14 We would like to propose the idea when we get enough data from the ships. In the near future, electronically controlled engines will become more popular. Such engines may run in a very wide range of operation pattern and may need another criteria of monitoring records evaluation.
Future plan
15 Plenty of useful data have been collected. Detail analysis will be done soon to get more information for practical application of the monitoring method. Japan is ready to accept, willingly, the comments and ideas on the project from any other parties interested in this project.
Action requested of the Sub-Committee
16 The Sub-Committee is invited to fully take into account the results and information from this project in the drafting work of the NOx monitoring guideline. Especially following points should be considered carefully to make the monitoring method more practical and acceptable for many ship-owners.
| |
1. |
Effectiveness of zirconia sensor |
| |
2. |
Calibration interval of the instruments |
| |
3. |
The method of monitoring data recording |
| |
4. |
The method of monitoring data evaluation |