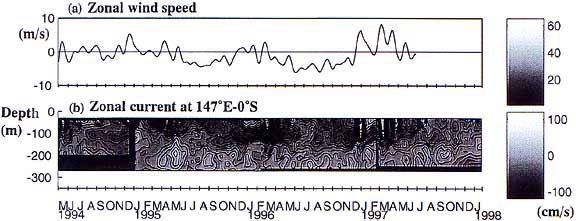
Plate 1 (a) Time series of zonal wind speed. ECMWF data (147.375。?) were used before January 1997 and NSCAT data (147。?) were used after that. (b) Zonal current at 147。?. Low pass filter of cutoff period at 30 days was applied to all the data.
The zonal current was mostly westward in the upper layer from 1995 through 1996 excet during the time when westerly wind blew which occurred mostly during the boreal winter. This westward current, South equatorial current (SEC), reached to about 100-150m after the spring of 1995 until the summer of 1997 except during the boreal summer. The sub-surface eastward current is the equatorial undercurrent (EUC) and it showed annual variation as well as variations of much shorter time scales. The upper boundary of EUC was located at about 140m after the spring of 1995 until the spring of 1997 except during the boreal summer when EUC spread upward and formed secondary core at about 100m. EUC shoaled slightly in boreal winter when westerly wind was dominant. The velocity of EUC near the core increased during the boreal summer. After the spring of 1997, EUC started shoaling considerably.

The uppermost panel of Plate 2 shows the contour of the sea surface height anomalies along the equator observed by TOPEX/POSEIDON. White horizontal lines were drawn at 147°E and at 156°E. There were several events propagating eastward from the western Pacific, and strong negative anomalies were developing in the western Pacific since mid-1997. The rest of the panels of Plate 2 are, from the upper panel, the time series of NSCAT zonal wind speed at 147°E(Plate 2b), time-depth contour of zonal current at 147°E(Plate 2c), time-depth contour of isotherm at 147°E(Plate 2d), time-depth contour of meridional current at 147°E(Plate 2e), time-depth contour of zonal current at 156°E (Plate 2f), time-depth contour of isotherm at 156°E (plate 2g), pseudo zonal wind stress observe by NSCAT and averaged from December 15 through December 31 1996(Plate 2h) and pseudo zonal wind stress averaged from March 1 through March 20 1997(Plate 2i). Low pass filter was applied to all the current and temperature data. The white lines on Plate 2c, e and f shows 28℃ isotherm.
Comparing with other near-surface eastward currents caused by WWB (referred to as NSEC hereinafter) since the start of our observations, the one in December 1996 was striking in terms of its amplitude near the surface and in terms of its penetration depth (Plate 1). The maximum current speed at 40m at 147。?-0。? was 1.6m/s, and an eastward current was observed as deep as 150m during this NSEC. Plate 2h shows that the center of the westerly wind during this event was west of 147。? and approximately at the equator. The effects of this event reached the west coast of South America in February 1997 (Plate 2a) and the propagation speed of this event roughly match the first mode baroclinic equatorial Kelvin wave. A relatively strong westward current near the surface in late March after the third NSEC coincided with the easterly wind. The fourth NSEC event from mid-April through early May appears to be related to the WWB in mid-April caused by twin cyclones across the equator (Kutsuwada et al., 1998). During the NSEC events which occurred from late June to early July or later, NSECs were stronger at 156。? than at 147。?, which reflects the eastward shift of the center of the WWB. The vertical penetration of NSEC was generally limited within the mixed layer after the third NSEC event.