|
3. SIMULATOR EXPERIMENT
The authors carry out simulator experiment in order to grasp correlation between overshoot angles provided in IMO's standards and the degree of manoeuvring difficulty felt by operators. The shiphandling simulator has been constructed by the authors for this purpose. The schematic of system configuration for the present simulator is shown in Fig. 6. Table 2 shows an outline of present simulator.
The situation of passing ship in a curved, narrow waterway is taken as simulation scenario. The authors select the east waterway of designated area of Inchon Harbour Approaches. Fig. 7 shows the map of selected waterway.
| Fig.3 |
Relation between spiral loop width and the 1st overshoot angle of 10 deg Z-test by numerical simulation |
Fig.4 |
Relation between the 1st and the 2nd overshoot angles of 10 deg Z-test by numerical simulation |
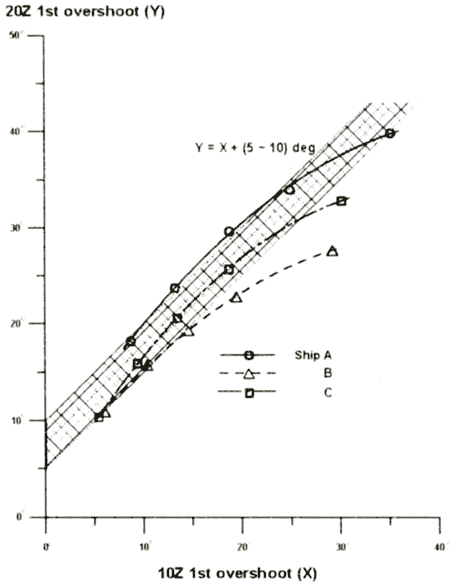
Fig.5 |
Relation between the 1st overshoot angle of 10 deg Z-test and the 1st overshoot angle of 20 deg Z-test by numerical simulation |

The depth of waterway is assumed to be deep enough Wind and current are applied to ship as external forces. Wind velocity is considered as 10 m/sec from WNW(293) and current as 2 kt to NE(050). One of the mission to shiphandling is passing along the waterway centerline as possible and the other is keeping propeller revolution constant as that of harbour full speed. That is 12 kt in training ship, 17.6 kt in container ship and 10.8 kt in bulk carrier respectively. Only rudder command is allowed and operator issues the order to helmsman orally. Six ship operators participate in the simulator experiment. Five operators are pilots on service in Korea, who have pilotage experience of one to five years after serving on merchant ships for about 10 years or more. And remaining one operator is one of the authors, who has captain experience of 3 years. Before the simulator experiment, brief explanation is given to operators on purpose of experiment, tested ships, waterway, external environment, mission to shiphandling and so on. Simulator experiment is executed using three models of series-ships, such as training ship, container ship and bulk carrier series models. Fig. 8 shows root-mean-square value(RMS) of ship's lateral deviations from waterway centerline during simulation. We can see that lateral deviation hardly has correlation with spiral loop width. Fig. 9 shows root-mean-square value of rudder angles applied during simulation. Applied rudder angle has correlation with spiral loop width, even though some differences in magnitude are appeared according to model of series-ships, namely the ratio of ship length to design speed(L/V). Fig. 10 shows degree of manoeuvring difficulty in terms of rating scale evaluated subjectively by operators. The evaluation has 10 rating scales from 0 to 9. Larger rating scale means more difficulty of manoeuvring. The rating scale is evaluated by operators immediately after every execution of simulation. The subjective evaluation rating scale has strong correlation with spiral loop width. Figs. 11, 12 and 13 show IMO A751(18) criterion diagram, on which the overshoot angle and the mean value of rating scale according to spiral loop width of three models of series-ships have been marked and displayed. In Fig. 11, the IMO criterion on the 1st overshoot angle of 10 deg Z-test was decided to different values along L/V in order to take the steering speed into consideration. However the simulator experiment tells us that manoeuvring difficulty rather decreases as L/V decreases, in case the overshoot angle is nearly the same. So the authors propose 20 degrees as the limit line of the 1st overshoot angle of 10 deg Z-test regardless of L/V values, which means almost 5 in rating scale. In Fig. 12, the authors propose 40 degrees as the limit line of the 2nd overshoot angle of 10 deg Z-test regardless of L/V values, which has been decided in consideration of rating scale 5 in manoeuvring difficulty and also numerical simulation result on the relation between the 1st and the 2nd overshoot angles in 10 deg Z-test (cf. Fig. 4).
|