|
ANNEX
The European Shipbuilding and Ship Repair Industry - Key Data
The information provided here is based on data presented in the AWES annual report for 2002. AWES is the association of European Shipbuilders and Shiprepairers, with members in Norway, Finland, Poland, Germany, the Netherlands, Denmark, Great Britain, France, Spain, Portugal, Italy, Croatia, Greece and Romania. All data refer to AWES and cover shipbuilding and ship repair activities only. Figures for the marine equipment industry are not included.
1. Market shares
In terms of completions, i.e. tonnage delivered during the periods in question, European producers were able to maintain their share until 2002. Korea increased output, but rather to the detriment of Japan. The completions in 2002 reflect orders that were taken in 2-3 years earlier, and it should be noted that towards the end of 2000 order intake for European yards increased due to the abolition of operating aid. In terms of new orders, the situation changed after the end of 2000: European order in-take decreased while Japan recovered due to strong domestic demand. The combination of the graphs shows that European producers did not participate in the increased ordering activity since 2000 to the same extent as their main competitors, but are still busy in the completion of past orders. The failure to maintain an important share in new orders has many reasons: The decline in cruise ship orders (a mainstay of European production) after the events of 11 September 2001, the aggressive pricing policies of Korean yards, in particular with regard to Liquefied Natural Gas tankers (another stronghold of European yards), the emergence of China as a major shipbuilding nation, the strong domestic demand in Japan that is traditionally inaccessible for non-Japanese producers and the surge in orders for oil tankers (a very simple shiptype whose production is no longer relevant for European yards), following the latest European maritime safety legislation.
2. Employment and production
WORKFORCE IN EUROPEAN SHIPBUILDING AND SHIP REPAIR
| |
1975 |
2002 |
Drop in percent |
| Country |
Total |
Newbuilding |
Total |
Newbuilding |
Total |
Newbuilding |
| |
|
|
|
|
|
|
| BELGIUM |
10245 |
6586 |
0 |
0 |
100% |
100% |
| CROATIA |
|
|
10957 |
8464 |
|
|
| DENMARK |
18900 |
15300 |
3360 |
2820 |
82% |
82% |
| FINLAND |
18000 |
17000 |
6150 |
6000 |
66% |
65% |
| FRANCE |
40354 |
24938 |
6800 |
5200 |
83% |
79% |
| GERMANY |
105988 |
71598 |
23300 |
16800 |
78% |
77% |
| GREECE |
10159 |
2316 |
3000 |
750 |
70% |
68% |
| IRELAND |
1633 |
1427 |
0 |
0 |
100% |
100% |
| ITALY |
36260 |
21460 |
13438 |
9606 |
63% |
55% |
| NETHERLANDS |
39850 |
20850 |
9000 |
3800 |
77% |
82% |
| NORWAY |
29000 |
16500 |
5266 |
3707 |
82% |
78% |
| POLAND |
|
|
20132 |
15073 |
|
|
| PORTUGAL |
17100 |
7000 |
2350 |
1284 |
86% |
82% |
| ROMANIA |
47000 |
27800 |
20400 |
19100 |
57% |
31% |
| SPAIN |
|
|
7876 |
6234 |
|
|
| SWEDEN |
31500 |
25000 |
|
|
100% |
100% |
| UNITED KINGDOM |
55999 |
48272 |
7000 |
2500 |
87% |
95% |
| TOTAL |
461988 |
306047 |
139029 |
101338 |
70% |
67% |
|
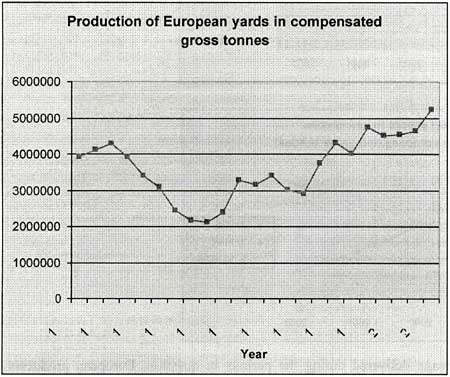
The available information shows that employment in European shipbuilding has decreased by nearly 70% since 1975, with a number of countries ending all shipbuilding activities for good. At the same time output remained at a very high level, with a further increase since 2001 when cruise ship orders placed before 11 September 2001 came up for delivery. The reasons for this dramatic productivity increase are new improved production methods, the closure of many less efficient yards and a significant shift in the production portfolio, from standard shiptypes such as tankers and bulk carriers to sophisticated vessels such as cruise ships. It should, however, be noted that deductions on competitiveness of the industry are notoriously difficult to make due to the cyclical nature of the business, the interaction with the highly volatile shipping industry, technological developments regarding new shiptypes and massively increased ship sizes, wide-spread trade distortions and the nature of shipbuilding with long delays between ordering and delivery and an extremely diverse range of products that makes direct comparisons between competitors problematic.
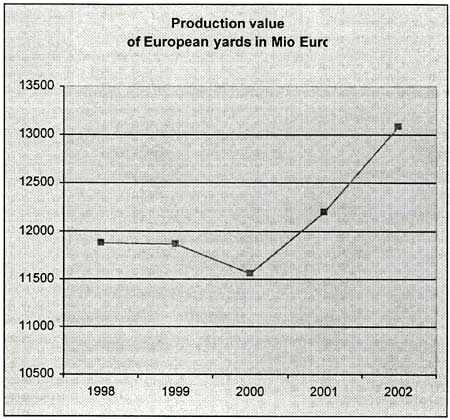
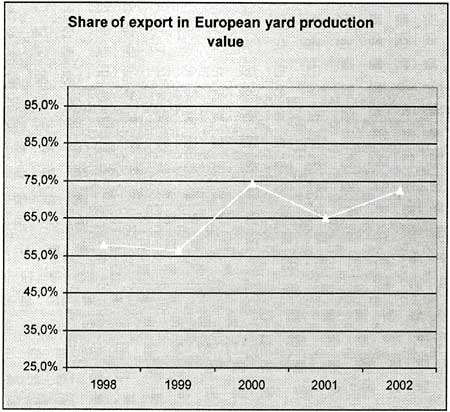
3. Production value and export share
In line with the information provided under 2. the above graph (top) shows the development in production value for European shipyards since 1998. In particular the completion of a large number of cruise ships has contributed to the increase in production value since 2000, a fact that is also reflected in the share of exports (i.e. orders for foreign accounts) which reach nearly 75% of the entire production value.
|