|
2. MARKET ANALYSIS
2.1. Market developments and market shares
The year 2001 was particularly difficult for the world shipbuilding industry. The surge in new orders recorded in 2000, triggered by very low prices and making 2000 a record year in the history of shipbuilding with new orders reaching the level of more than 29 Mio. cgt (compensated gross tonnes), proved to be unsustainable. Total orders were 21 % lower in 2001 compared to 2000 (based on cgt), as market segments reached saturation and even lower offer prices failed to cause additional speculative ordering.
This development was further accelerated by the abolition of operating aid in the EU from 1 January 2001, bringing forward orders to EU yards, the world-wide economic slump, lowering the demand for transport services and thus depressing freight rates and consequently newbuilding demand, and the effects of the terrorist attacks of 11 September 2001.
While the decline in the world's major economies mainly affected the liquid bulk and the container segments, the events of 11 September had a strong impact on the cruise industry which saw three bankruptcies and a significant drop in bookings. Cruise operators then took a reluctant stand and consolidated operations (e.g. by pursuing mergers or departing from certain cruise areas) rather than aiming for further expansion. Consequently almost no orders for cruise ships were recorded in 2001 (the only orders placed concerned some smaller, specialised ships for Antarctic cruises where terrorist threats are considered low and customers in general are less prone to cancellations). On the contrary, some orders for new cruiseships were postponed and options for additional ships were not exercised.
As a result the maritime industries in general are facing a bearish mood. Although many shipyards are still well occupied with the orders placed in 2000 (and earlier), there is an increasing uneasiness about the situation after 2003 when most of the previous orders will have been completed. This concerns in particular those companies which have technical constraints (dock size, design capabilities) and therefore a narrow product focus, which are already highly specialised with regard to shiptypes built, which cannot count on the creation of new demand, e.g. through domestic orders or which are not in the position to develop a naval shipbuilding portfolio as an alternative to merchant shipbuilding. Unfortunately these characteristics apply to the majority of yards in the EU and in the European Economic Area.
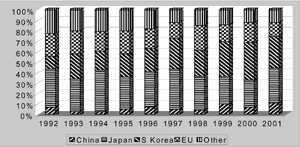
The delays in the publication of ordering statistics do not allow to give a final analysis of 2001 yet, but the Commission undertook significant efforts to consolidate available information and develop it into a longer time series. The result is presented in the graph below.
Fig.1 - Market shares in new orders in percent and based on cgt, all shiptypes, 1992-2001
| (拡大画面:33KB) |
 |
| Year |
China |
Japan |
South Korea |
EU |
Other |
| 1992 |
7% |
37% |
12% |
22% |
23% |
| 1993 |
3% |
31% |
24% |
22% |
20% |
| 1994 |
3% |
40% |
18% |
19% |
21% |
| 1995 |
5% |
31% |
22% |
22% |
20% |
| 1996 |
7% |
34% |
22% |
19% |
18% |
| 1997 |
5% |
38% |
29% |
15% |
12% |
| 1998 |
4% |
33% |
25% |
24% |
15% |
| 1999 |
10% |
26% |
33% |
16% |
14% |
| 2000 |
7% |
26% |
36% |
19% |
12% |
| 2001 |
11% |
33% |
30% |
13% |
12% |
|
| Source:Lloyd's Register/Fairplay |
It can be seen that in 2001 South Korea and the EU saw decreasing market shares while Japan and China (PRC) managed to increase their respective shares. This can be explained by the developments described above: Korean yards had very much focussed on the market for tankers and containerships, and EU yards are strong in the construction of cruise ships. All these segments were massively affected by the effects mentioned earlier, and shifts in product focus (South Korean yards turning to the construction of LNG carriers, EU yards expanding their ferry and Ro/Ro portfolios) were not at all sufficient to compensate for the overall decline in orders. Nevertheless South Korea still maintains a market share significantly higher than the one it had in the year before the Asian crisis. On the other hand Japan saw a surge in domestic orders and benefited from a weaker Yen compared to the USD, while China became a prolific builder of product tankers through low offer prices and improved quality, Nevertheless the situation in all major shipbuilding regions is seen as problematic as newbuilding prices decline further and profits are very difficult to achieve (see next chapter). Therefore the bottom line for many yards is to stay in business and minimise losses as far as possible.
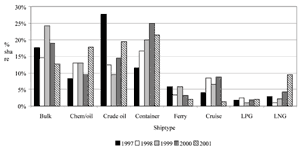
In order to give an impression about the shipbuilding market in general, the graph below provides a breakdown of new orders during the last five years by shiptype.
Fig.2 - Change in distribution of orders based on cgt, 1997-2001
| (拡大画面:17KB) |
 |
Source:Lloyd's Register/Fairplay
- European Commission
|
|
Four main volume ship types dominate the market: bulk carriers, chemical/oil products tankers, crude oil tankers and container ships. Together these ship types accounted for 73 % of the total order intake in 2001 (in cgt). Other market sectors effectively make up niche markets, the largest of which are the cruise and LNG sectors. The decline of the cruise sector and growth of the LNG sector are particularly marked in the above chart.
LNG carriers are the only market segment that saw an absolute increase in ordering for new ships in 2001. Although LNG carriers represent a niche market in terms of volume (less than 2 % of the number of ships on order is for LNG carriers; in terms of cgt the share of LNG carriers is ca. 8 % of the existing order volume), the ships are highly sophisticated and comparatively expensive, with unit prices of ca. 170 Mio. USD. Key patents for the cargo containment systems are held by European companies.
Fifty LNG carriers are currently on order world-wide, with 28 more options. The confirmed orders represent nearly 36 % of the currently existing fleet of LNG carriers (in number of ships). Korea holds 65 % of these orders (by cgt), with Japan taking ca. 25 % and the EU 10 %. Of the 30 new orders placed in 2001 (there were only orders for four ships world-wide in 1998), Korea took an even greater share (by cgt): 79 %, compared to 14 % for Japan and 7 % for the EU. This means that this segment which was dominated by Japanese and European yards (mainly in France and Finland) before the Asian crisis, is now mostly controlled by Korean yards. The sector has seen tremendous growth in 2001, but prices for LNG carriers have declined from 190 Mio. US Dollars per ship in 1998 to less than 170 Mio. US Dollars in 2001 which can hardly be explained by productivity increases or technical Progress alone. Some orders in Korea, placed in late 2000 at the beginning of the market expansion, were even reported to be priced below 145 Mio. US Dollars. It appears that Korean shipbuilders see the LNG sector as the next growth area in which they try to gain market shares. In particular Daewoo has been very active in this sector, taking most of the orders placed in Korea. It should be noted that Daewoo underwent a complete restructuring in 2000, during which the largest part of the company's debts were forgiven or converted to equity held by the main creditor, the Government-controlled Korean Development Bank (KDB).
While there is some reason to believe that the shipment of natural gas will increase in the future due to environmental concerns and the needs of emerging economies such as China, it should also be noted that some orders for LNG carriers were related to the energy crisis in the USA in early 2001 which in the end proved to be of temporary nature. Furthermore some orders related to Enron Corp. and probably these may now be reviewed.
The issue of newbuilding contract prices is one of the most non-transparent in the shipbuilding industry. Neither shipowners nor shipyards are very open when it comes to reporting prices. This is mainly due to the fact that shipbuilding is about large individual orders, fostering a close relationship between yard and customer. While the yard may wish to attract certain customers through competitive pricing (and/or a particularly high specification), the owner typically does not want to reveal a favourable purchase as this may lead his customers to ask for equally favourable terms with regard to charter terms or freight rates. Therefore, reliable pricing information is difficult to come by.
The source mostly referred to is H. Clarkson Ltd.11 and its various subsidiaries (in particular Clarkson Research). While Clarkson is a well recognised company in the field and their data is also used by international organisations such as the OECD, the Commission sees a number of problems with regard to the information provided. Clarkson price information is related to certain standard shiptypes (with a number of important shiptypes such as Post-Panamax containerships or passenger ships being absent), not to actual contracts concluded. The complexity of ships ordered in terms of technical specification, series production and financing terms is not reflected in the single figure given for each subtype. Finally, Clarkson also acts as a broker which may influence positively their view on the market.
Indeed, the Commission's detailed price investigations for specific contracts showed that in almost all cases the prices reported by Clarkson for a comparable ship were higher than the ones found through direct investigations. Suezmax tankers may serve as an example: Clarkson reports the price for a standard Suezmax tanker of 150 000 dwt as 46,5 Mio USD (end 2001) and Fearnleys indicates a price of 48,0 Mio USD, while the Commission's market monitoring observed several orders at a price of 43,0 Mio USD, i.e. 7 to 10 % lower than reported by those companies. Nevertheless, this report continues to present price information as provided by Clarkson as the most important source, but reserves the right to complement this information with its own findings.
| Table 1 - Clarkson Research price data for bulk shiptypes |
| Shiptype |
Price (Mio. USD) |
| End-1999 |
End-2000 |
End-2001 |
| Tankers |
VLCC |
300 000 dwt |
69,0 |
76,0 |
70,0 |
| Suezmax |
150 000 dwt |
42,5 |
52,0 |
46,5 |
| Aframax |
110 000 dwt |
33,0 |
41,0 |
36,0 |
| Panamax |
68 000 dwt |
31,0 |
35,5 |
32,0 |
| Bulkers |
Capesize |
170 000 dwt |
35,0 |
40,0 |
36,0 |
| Panamax |
75 000 dwt |
22,0 |
22,0 |
20,5 |
| Handymax |
51 000 dwt |
20,0 |
20,5 |
18,5 |
| Handysize |
30 000 dwt |
15,5 |
15,0 |
14,5 |
|
| Table 2 - Clarkson Research price data for specialised
shiptypes |
| Shiptype |
Price (Mio. USD) |
| End-1999 |
End-2000 |
End-2001 |
| LNG carrier |
138 000 m3 |
165,0 |
172,5 |
165,0 |
| LPG carrier |
78 000 m3 |
56,0 |
60,0 |
60,0 |
| Container |
400 TEU |
8,5 |
10,0 |
8,9 |
| Container |
1 100 TEU |
17,5 |
18,0 |
15,5 |
| Container |
3 500 TEU |
38,0 |
41,5 |
36,0 |
| Ro/Ro |
1 200 - 1 300 lm |
21,5 |
20,0 |
19,0 |
| Ro/Ro |
2 300 - 2 500 lm |
32,5 |
33,0 |
31,0 |
| Tweendecker |
15 000 dwt |
13,0 |
13,8 |
13,8 |
|
The information provided by Clarkson Research confirms the general downward trend in ship prices. This applies to all standard shiptypes and reflects the generally negative sentiment in the market, despite rising costs stemming from inflation, wage increases and higher prices for raw materials priced in USD in all major shipbuilding regions. This trend is equally confirmed through information provided by the Norwegian company Fearnleys12, as published by their subsidiary Fearnresearch. Fearnleys uses a slightly different breakdown of shiptypes with variations in size and specification. An overview, indicating slightly higher price levels for most of the major shiptypes, is given below.
| Table 3 - Fearnresearch price data for various shiptypes |
| Shiptype |
Price (Mio. USD) |
| End-2001 |
| Tankers |
VLCC |
280 000 dwt |
72,0 |
| Suezmax |
150 000 dwt |
48,0 |
| Aframax |
105 000 dwt |
37,0 |
| Panamax |
68 000 dwt |
n/a |
| Bulkers |
Capesize |
170 000 dwt |
36,5 |
| Panamax |
75 000 dwt |
20,0 |
| Handymax |
53 000 dwt |
18,0 |
| Handysize |
30 000 dwt |
n/a |
| Container |
Gearless |
3 500 TEU |
37,0 |
| Gearless |
2 750 TEU |
32,0 |
| Geared |
1 700 TEU |
22,5 |
| Geared |
1 000 TEU |
16.0 |
|
Prices in South Korean shipyards, which are considered the price leaders for most shiptypes13, are monitored by the Commission on a contract by contract basis to gain a more accurate picture of developments. This information is used in order to assess the pricing policies of individual Korean yards and the shiptypes in their portfolio. A full presentation of this analysis would be too detailed and thus go beyond the scope of this report.
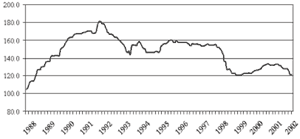
Price information has been accumulated and price developments are presented below in the form of an index with the price level of 1987 equalling an index of 100. The index is based on published information from brokers and other sources and it shows the long term price trend as analysed by the Commission's consultant. The index is continuously updated with the information contained in the monthly monitoring reports.
Fig.3 - Newbuilding price index (1987=100)
| (拡大画面:12KB) |
 |
| Source:European Commission |
The index clearly shows the massive drop in prices following the Asian crisis of 1997/98 and the subsequent efforts to increase prices along the ordering boom in 2000. The (not very pronounced) trend towards better prices stopped in late 2000 and for the year 2001 the trend was reversed as had to be expected with the number of incoming orders falling. It is noteworthy that 2001 price levels are only ca. 20 % higher than they were in 1987, i.e. prices did not keep pace e.g. with inflation.
With very limited ordering expected for 2002, price recovery will be difficult to achieve, although yards may be inclined to look for orders in those segments that have been less affected by price erosion. Past experience has, however, shown that this behaviour does not improve the financial results of yards, but rather leads to additional price erosion in the targeted sectors, as long as the market is characterised by over-supply.
The Commission will continue its price monitoring and will, in accordance with market developments, put increasing emphasis on production in China. Chinese shipbuilders have expressed their intention to aim for a large scale expansion of facilities, quoting South Korea as an example to follow. This is likely to lead to further price decline, unless China herself creates significant additional demand for ships. With China now being a full WTO member, this issue should be addressed before more shipbuilding capacity enters the market.
13 Chinese yards can be considered the price leaders for general cargo ships (tweendeckers) and product tankers with low specification; Japan has recently become very competitive again for standard bulk carriers (for which it has specialised yards that benefit from serial production) after the recent decline in the Yen/USD exchange rate. However, for all commercial shiptypes which would be in the range of EU yards, Korean yards set the prices.
|