|
RESULTS
Nutrient analysis
The two sets of data analyzed by AFCD and in situ are plotted in Figure 2. In the case of phosphate, the general trend of the data from the AFCD and the auto-nutrient analyzer are almost consistent, except for the reading (4 μgL-1) from the AFCD at 04:00h on 31 January 2002. Results for phosphate concentration by the AFCD were within the range 13 - 16 μgL-1, and within the range 10 to 17 μgL-1 from the auto-nutrient analyzer. However, for nitrate, they were totally different. The variation between the results from the AFCD and the auto-nutrient analyzer were widely inconsistent. A negative reading for nitrate was also recorded.
| (Enlarge: 19KB) |
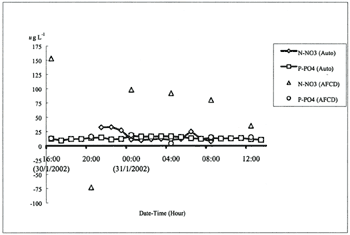 |
Figure 2. Time series of nutrient dynamics on 30 to 31 January 2002
(Auto: analyzed by in situ auto-nutrient analyzer; AFCD: analyzed with a ChemLab Continuous Flow Analyser)
Nutrient ratios of TIN:DIP
The general pattern of TIN:DIP ratios calculated from the AFCD results (Fig.3.) were generally within the range 5 to 19, except for two readings below 5 at 08:00 and 12:00 on 31 January and a value of 37.7 at 04:00 on 31 January 2002, due to an 'unusual' reading as discussed above.
| (Enlarge: 20KB) |
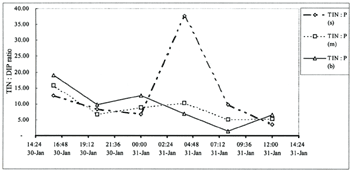 |
Figure 3. Time series with 4-hour intervals of TIN:DIP ratios on 30 to 31
January 2002
| (Enlarge: 23KB) |
 |
| (Enlarge: 21KB) |
 |
| (Enlarge: 23KB) |
 |
| (Enlarge: 24KB) |
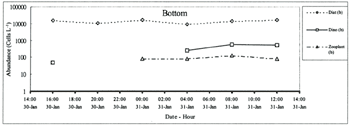 |
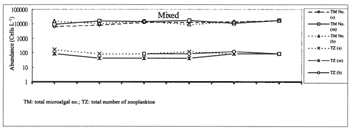
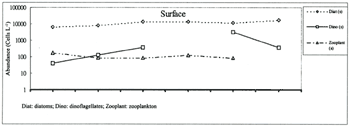
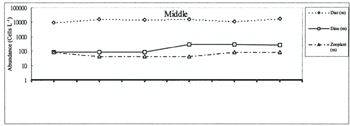
Figure 4. Diurnal dynamics of marine microalgae and abundance of zooplankton
Diurnal microalgal dynamics
The diurnal dynamics of marine microalgae and the abundance of zooplankton are shown in Figure 4, in which the plot at the top is for total microalgal and zooplankton abundance at the different water depths, and the other three plots labeled 'surface', 'middle' and 'bottom' are the results for the individual water depths 1 m, 3 m and 5 m respectively. Only two groups of microalgae (diatoms and dinoflagellates) were found in the water samples during the diurnal observation.
LIMITATIONS, DISCUSSION AND RECOMMENDATIONS
The two 'unusual' readings, one for phosphate and one for nitrate, in Figure 2 warned that sometimes, attention must be paid to the reliability of results from a benchtop continuous flow analyzer, even though it is commonly and routinely operated. Results may not always meet expectations. If the reading for phosphate at 04:00h on 31 January 2002 is reliable, it could be deduced that the variation in an interval of four hours was very rapid. Thus, Hiiro et al. (1989), who pioneered the development and application of telemetry for red tide studies, pointed out that concentration of nutrients could change rapidly (on a time scale of one hour). However, there seems to be little evidence to support this hypothesis, since neither the AFCD results, nor the results of the hourly series from the in situ auto-nutrient analyzer showed any obvious trend for such fluctuations and, furthermore, no noticeable variation could be seen from the corresponding microalgal abundance. Thus, such a supposition is unlikely and the results should be treated as invalid. For the negative reading of nitrate in the AFCD data set, it probably implies that the concentration of nitrate at that particular moment was undetectable. Unfortunately, no corresponding data were available at this time from the auto-nutrient analyzer for comparison because of a fault which occurred in the programming of the auto-nutrient analyzer.
Since this was a pilot test, there are certain limitations and difficulties. The data lost due to the programming fault was a technical problem and underlined the need to make improvements to ensure the programming work is done properly. Furthermore, the chemicals used in the analyzer have to be disposed of and then replenished, and this demands human resources for routine maintenance and calibration. In addition, the traditional approach to using auto-nutrient analyzers in the laboratory requires a filtering procedure, and it is not known whether there would be any effect from the direct injection of water samples and their reaction with the chemicals in the in situ auto-nutrient analyzer. If a filtering procedure is needed, a sub-system needs to be required designed for such purpose in order to collect reliable data.
In order to perfect the sub-system and provide meaningful and comprehensive nutrient data, it is recommended that further analyzer modules such as silicate and ammonia, are integrated into the sub-system, so as to form part of the telemetry system. For ensuring data reliability, calibration tests still need to be carried out using standards to test and compare the results from the traditional method used in the laboratory and the auto-nutrient analyzer.
As pointed out in the Introduction, nutrient ratios played an important role
in red tide occurrences in Tolo Harbour as well as other Hong Kong waters, and TIN:DIP ratios during this
diurnal observation were also found to fall within the range 4-22 documented by Ho and Hodgkiss (1993).
However, based on the corresponding results for microalgal abundance, there was no significant variation
observed during these diurnal studies and diatoms dominated throughout the period of observation. The
zooplankton abundance was far below the total microalgal abundance at each water depth and this suggests
that zooplankton was dependant on the microalgae, but probably exerted no significant grazing pressure
on the microalgal community. This result is consistent with the observation of Yang
(2000) at Port Shelter.
As revealed in the review by Hodgkiss and Ho (1997),
both long term and relatively short-term changes in the N:P ratio are accompanied by increased blooms
of non-siliceous phyloplankton groups. Thus, diumal observation should help to understand the moment by
moment variation in nutrient dynamics. However, attempts to establish any relationship between red tide
and nutrient ratios at Crooked Island were unsuccessful. More data and a longer observation period are
needed to provide enough baseline data for analysis and to validate whether or not N:P ratios apply at
Crooked Island.
Application of telemetry for studying marine microalgal dynamics and monitoring
algal blooms has shown some success in terms of a surface bloom or a subsurface bloom at Crooked Island,
Hong Kong ( Lam and Hodgkiss, 2000, 2001).
But, there is no real time in situ and continuous nutrient data for understanding the conditions
preceding a red tide as well as the dynamics of the microalgae. However, it is well known that marine
microalgal dynamics as well as red tides are subject to the influence of different environmental parameters,
sometimes acting individually, but in synergy at other times ( Lam and Hodgkiss,
2000). One of these factors is nutrients. Undoubtedly, nutrients are an essential factor because there
will be no dynamics and no algal blooms if there are no nutrients, even when other conditions are favorable.
But, the conventional approach to studying the interaction between nutrients and marine microalgal dynamics
is to take water samples alongside microalgal samples back to the laboratory for analysis and then try
to establish any co-relationship. However, such discrete and periodic sampling results have the same limitations
as conventional sampling for microalgae: any variation during the sampling interval is ignored. |