|
ESTIMATION OF VERTICAL PROFILES OF SUSPENDED SEDIMENT AND ENTRAINED AIR BUBBLE
The vertical profile of suspended sediment concentration is estimated by the
following Vanoni Distribution, Equation (1) ( Vanoni, 1975).
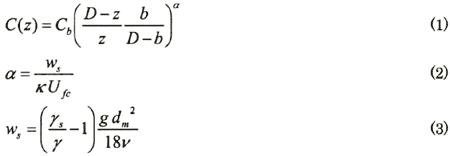
where, C(z) is the vertical profile of suspended sediment concentration,
Cb is sediment concentration at the reference height, b (m), z
is the height from bottom (m), D is the depth (m), ws is the fall
velocity of particle (m/s), κ is von Karman's constant (=0.4), Ufc
is the critical friction velocity due to current and wave (m/s), γ, γs
is the density of water and sediment (kg/m 3), respectively, g is the
acceleration of gravity (m/s 2), dm is the mean
diameter of sediment particle (m) and ν is the kinematic viscosity (m 2/s).
As this distribution was originally proposed by Rouse (1937), α is called as Rouse number. Ufc
is estimated using by the logarithmic current profile analysis by Rose et al. (2001),
Soulsby et al. (1987), and using the turbulent kinetic energy method with the
approximation of quasi-steady flow condition and turbulence data of Soulsby (1983)
and Rose et al. (2001). Equation (1) was proposed for steady currents. In this
study, the following equations are employed to estimate Ufc ( Fredsoe
et al., 1992) taken into account the critical friction velocity in wave and current condition,
| (Enlarge: 13KB) |
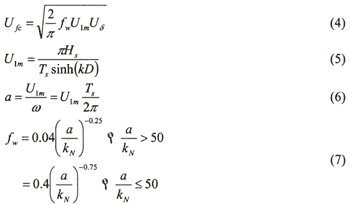 |
where, fw is the friction coefficient, Uδ is the mean current (m/s), U1m is the current due to wave (m/s), Hs is the wave height (m), Ts is the wave period (s), ω is the angular frequency of waves, k is the wave number and kN is the bottom roughness length (m). The ADCP data near the sea bottom are used as Uδ, Hs and Ts are given by wave gauges' data.
As mentioned before, the LISST-25 data contain both sediment particles and entrained air bubbles caused by surface wave breaking. It is necessary to separate suspended sediment and bubbles in the data. First, the vertical profile of sediment concentration is estimated by above equations with two measurements near the bottom. C(z1) and C(z2), which are indicated in Figure-4. The reference concentration, Cb, and its height, b, are determined as an average of C(Z1) and C(z2), and that of z1 and z2. Then, the entrained air bubble concentration near the sea surface is estimated by subtracting sediment concentration from the observed concentration. Finally, the vertical profile of bubble concentration, Cbubble(z) is estimated by the least squares method with the exponential function, Equation (8).
Cbubble(z)=AeBz (8)
where, A and B are fitting parameters.
Figure 5 shows the estimated vertical profiles of suspended sediment, the entrained air bubble and the total concentration together with the raw data measured by LISST-25. The entrained air bubble concentration increases in proportion to the wave heights, which indicate the possibility of wave breaking.
In the separation scheme developed in this study, we assumed the zero concentration
of the entrained air bubble at the sea bottom (actually. 1 μl/l was assumed instead of the zero concentration).
However, the entrained bubbles of wind wave breaking can be measured even at the point of five times of
the significant wave height ( Yoshioka et al., 1998). Since the observation
in this study was carried out inside the surf zone in the storm condition, the assumption of zero-concentration
at the sea bottom is not always valid. There is some possibility of overestimation of suspended sediment
concentration near the bottom.
| (Enlarge: 25KB) |
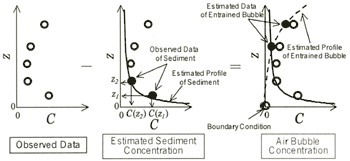 |
Figure 4. The separation scheme of suspended sediment and air bubbles in
the vertical profile of concentration data measured by LISST-25
| (Enlarge: 39KB) |
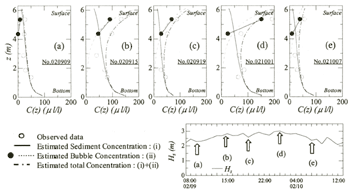 |
Figure 5. Estimated profiles of suspended sediment and air bubble concentrations
NET FLUX OF CROSS-SHORE SUSPENDED SEDIMENT
Net flux of cross-shore suspended sediment per unit width. Qs, is calculated by multiplying the estimated sediment concentration, C(z), by the mean current, U(z), as shown in Figure 6. The successive results of the net flux of suspended sediment is shown in Figure 7. The sediment flux becomes larger when strong offshore-going current Uoff occurs. Then, the volume of the sediment flux corresponds to the magnitude of the mean current U(z). The total sediment flux during this storm, Qs |Total is also calculated with Equations (9) and (10), resulting in the approximation of 10 m3/m/storm.
where, z =1.35 m to 5.1 m, dz = 0.25 m, T = 29 hours and ΔT = 2 or 3 hours.
As a representative parameter of wave energy flux, the following F is defined based on the significant wave height and period:
F=Hs2Ts (11)
The linear relationship between the estimated sediment flux, Qs and the wave energy flux, F, is shown in Figure 8. It is revealed that offshore-going sediment occurs when wave energy flux exceeds a critical value, Fc. Thus, it will be possible to estimate offshore-going sediment flux based on the wave conditions in the surf zone.
| (Enlarge: 17KB) |
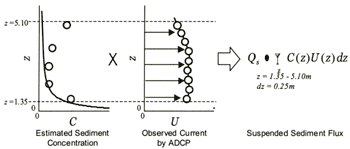 |
Figure 6. Calculation of suspended sediment flux using the estimated and
observed data
Figure 7. Time series of estimated offshore-going sediment flux during the
storm condition
Figure 8. Relationship between wave energy flux and cross-shore flux of
suspended sediment
|