|
RESULTS
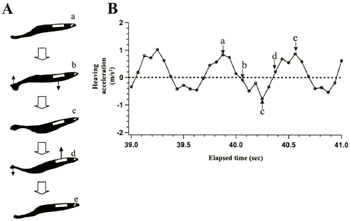
Approximately 20 hours of continuous behavior of the four individuals were recorded both by the video cameras and the acceleration data-logger. A visual analysis of videotapes revealed that all four fish spent most of the time lying on one side of their body on the bottom of the aquarium, also observed that they occasionally swam for a few minutes, either horizontally or vertically. While swimming, the fishes' entire body oscillated with an undulatory wave of vertical bending, progressing from the tip of the head to the end of caudal fin. While steadily swimming, the profiles of heaving acceleration, as recorded by acceleration data-logger, showed a cyclic and sinusoidal waveform (Fig.2A). When compared with the data from the video camera, the frequency of heaving acceleration was synchronized with the sequences of swimming activity (Fig.2B).
| (Enlarge: 15KB) |
 |
Figure 2. (A) Schematic diagrams, horizontal-view, of one cycle of undulatory
swimming in Japanese flounder. The wave frequency during steady swimming was 1.56 Hz. (B) Representative
example of a heaving acceleration profile for Japanese flounders while steady swimming, as recorded by
acceleration data-logger. The cycle frequency of heaving acceleration is synchronized with the photo sequences
of swimming activity (Fig.2A).
In addition, the fishes tail beat frequency could be visually identified within the cycle of heaving acceleration during steady swimming phases.
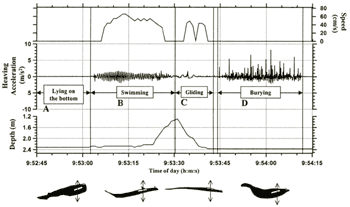
The activities of the instrumented flounder were divided into four major categories; lying on the bottom, swimming, gliding and burying, based on differences within the acceleration profiles. Four distinct behaviors of the Japanese flounder were categorized using the data recorded by the acceleration data-loggers:
(a) Lying on the bottom (Fig.3A). When lying on the bottom, each fish kept a rigid posture and its head, caudal fin and body laid flat on the bottom. Depth values remained constant around 2.3-2.5 m, and the swimming speed sensor recorded the 'stall speed' (<25 cm/sec.). Additionally, the acceleration remained constant at 0m/sec2. Thus, low and stable acceleration profiles indicate when the fish was lying on the bottom of the aquarium.
(b) Swimming (Fig.3B). Fish were able to start swimming from any lying position. After taking-off from the bottom of the aquarium, they moved their head upwards and downwards, while the body musculature expanded and contracted. Depth values and swimming speed ranged from 1.1-2.5 m and 25-153 cm/sec, respectively. The heaving acceleration profile showed a series of rhythmical waveform with amplitude ranging from 0.29 to 16.83 m/sec2 (mean±S.D.; 1.10±0.76). An example of typical heaving acceleration spectrum, whose frequency ranged from 0 to 6 Hz, is shown in Figure 4A. Heaving acceleration profiles of steady swimming had one or two marked peak in spectrum.
| (Enlarge: 36KB) |
 |
Figure 3. Depth, speed and heaving acceleration profiles for Japanese flounders,
showing (a) lying on the bottom, (b) swimming, (c) gliding and (d) burying.
(c) Gliding (Fig.3C). Prior to gliding, the fish would swim upward in the water column, and then, by positioning the head downward and flattering the body, glide downward to the bottom of the aquarium. When gliding, the heaving acceleration value was ca. 0m/sec2 or occasionally ± I m/sec2 and unchanging. Depth values decreased gradually as the fish descended towards the bottom of the aquarium.
(d) Burying (Fig.3D). Soon after landing on the bottom of the aquarium, the fish would bury themselves by alternately beating their head and tail against the bottom. When the fish were engaged in burying activity, the depth value was that of bottom of the aquarium, swimming speed was <25cm/sec. An example of typical spectrum of heaving acceleration while burying, is shown in Figure 4B (note: the frequency ranged from 0 to 6 Hz). Heaving acceleration profiles while burying, had multiple peaks.
Data for each of the behavioral categories, based on depth, swimming speed and heaving acceleration data recorded by acceleration data-loggers, are shown in Table 1. The duration of recorded behaviors for each fish ranged from 16.8 to 19.5h, (N=4). They spent most of their time (Fish 1; 89.5%, Fish 2; 94.1%, Fish 3; 92.2%, Fish 4; 94.5%) on the bottom of the aquarium. The sum of the swimming periods lasted from 55.9 to 122.6min (mean±S.D.; 83.1±29.8min, N=4), representing 5.5-10.5 % of the duration of the experiments. The sum of the gliding periods lasted from 5.9 to 16.2min (mean±S.D.; 9.9±4.8min, N=4), representing 0.5-1.4 % of the duration of the experiments. The sum of the burying periods lasted from 0.9 to 14.8min (mean±S.D.; 6.0±6.5min, N=L), representing 0.08-1.5 % of the duration of the experiments (Table 1).
Of the total 451 swimming periods recorded, the four fish swam at speeds ranging from 0.4 to 2.8 BL/sec, with a mean swimming speed ranging from 0.8 to 0.9 BL/sec. While steadily swimming, undulatory cycles in the recorded heaving acceleration (indicating tail beat frequency) occurred between 1.00 and 2.67Hz. Tail beat frequency increased linearly with increasing swimming speed (n=1508, r2=0.70, p<0.0001) according to the equation:
F = 1.08・V +0.87
where V represents the swimming speed (BL/sec) and F is the tail
beat frequency (Hz). During most of the time spent while swimming (88.1%), the frequency range of tail
beating was between 1.45 and 2.29 Hz, with a mean frequency of 1.65±0.47 to 2.04±0.25 Hz depending on
the individual. The fish rarely (0.75%) exceeded frequencies of 2.29 Hz, the highest frequency being 8
Hz.
Figure 4. Amplitude spectrum of heaving acceleration while swimming (A)
and burying (B).
Table 1. Summary statistics of swimming, gliding and burying behaviors for
the four Japanese flounders instrumented for this study.
| Fish No. |
Fish 1 |
Fish 2 |
Fish 3 |
Fish 4 |
| Record duration (hour) |
19.5 |
18.2 |
19.2 |
16.8 |
| Total number of taking off the bottom |
132 |
129 |
104 |
39 |
| Total swimming duration (min) |
122.6 |
64.8 |
89.2 |
55.9 |
| Mean duration of one swimming event (sec ± S.D.) |
53.0 ± 52.8 |
25.1 ± 12.3 |
42.1 ± 24.1 |
76.3 ± 54.4 |
| Maximum duration of one swimming event (sec) |
325 |
69 |
148 |
321 |
| Total gliding duration (min) |
5.9 |
11.0 |
16.2 |
6.3 |
| Mean duration of one gliding (sec ± S.D.) |
2.7 ± 2.9 |
5.1 ± 3.3 |
9.3 ± 5.5 |
9.6 ± 10.3 |
| Maximum duration of one gliding event (sec) |
17.1 |
15.3 |
28.4 |
47.2 |
| Total number of burying events |
52 |
10 |
14 |
85 |
| Total burying duration (min) |
7.0 |
0.9 |
1.1 |
14.8 |
| Mean duration of one burying event (sec ± S.D.) |
8.0 ± 5.0 |
5.2 ±4.4 |
4.8 ± 2.9 |
10.4 ± 9.0 |
| Tailbeat frequency (Hz) (range) |
1.84 ± 0.31 (1.14-5.33) |
2.04 ± 0.25 (1.33-2.67) |
1.65 ± 0.47 (1.10-8.00) |
1.73 ± 0.68 (1.00-8.00) |
| Mean swimming speed (cm/s) |
43 ± 9 |
58 ± 12 |
42 ± 12 |
46 ± 17 |
|
|