|
CLIMATIC TENDENCY IN PRECIPITATIONS
Statistically significant (95-99%) trends of precipitations for the second
half of the 20 th century (1945-2000) are revealed in large-scale areas of the
Northeast Asia for each month of a year. This result is not in agreement with conclusion on statistically
non-significance of precipitation trends estimated earlier by traditional LS method by Dashko et al. (1997), Rankova and Gruza (1998) and others. Sign and statistical
significance of semi-centennial trend of monthly precipitations in each season are shown in Figure 2.
Increase of precipitation in the second half of 20th century is found in large-scale continental areas
of the Northeast Asia predominating in October - May in moderate and arctic latitude zones. Typical monthly
precipitation rise of high statistical significance level (99%) there is 0.2-0.4 mm/year, and maximal
values are in range of 1.4-1.7 mm/year at some Russian meteorological stations in the continental area
of moderate latitudes.
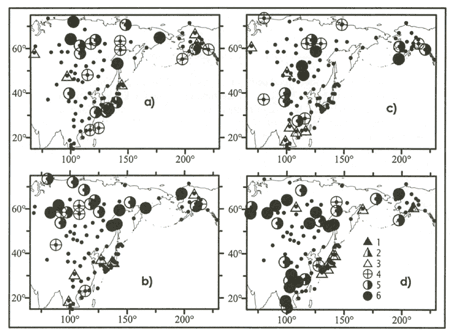 Figure 2. Negative (1, 2, 3) and positive (4, 5, 6) tendencies of precipitation
sum with significance levels: 90% (3,4), 95% (2,5) and 99% (1,6) in March (a), October (b), June (c),
and January (d) for the time series since 1945 till 2000
In October - February positive semi-centennial trend of monthly precipitation
sum occurs east of 55°E in the whole latitude band 45°-70°N, but in March, May and June it occurs in the
area east of 100E in the same latitude band. In February positive precipitation trend of high significance
level (99%) also occurs in tropical and subtropical marginal area east of 95°-100°E adjacent to the East-China
Sea, where the air temperature trend in this month is also positive. Week negative precipitation trend
in this subtropical area is found in May and October, and only at some meteorological stations it takes
place in the period from July to September. Bands of positive precipitation trend in summer months are
stretched out from southwest to northeast, parallel to the Northwest Pacific marginal zone as well as
(Fig.2c). In June positive precipitation trend occupies area along Pacific and Bering Sea coast of Alaska
and offshore band stretching out from continental area adjacent to the East-China Sea to the arctic coast
of the East-Siberian Sea. So, positive patterns of precipitation and air temperature trends are very similar
in the continental area of the Northeast Asia. Warming accompanies precipitation rise there. This result
is close to conclusion on the accompanying centennial trends of global/hemisphere means air temperature
and precipitations ( Bradley et al., 1986; Vinnikov et al., 1990; Kondratiev and Demirchan, 2001 and others). Weak negative trend of precipitation is found in Japan south of Hokkaido
and in Russian Primorye region adjacent to the Northwest Japan Sea. In this area of the NW Pacific marginal
zone centennial and semi-centennial warming accompanies precipitation decrease. Relatively week (>90%
significance level) negative precipitation trends of both centennial and semi-centennial (Figs.2c, d)
scales are found over Kyushu and Honshu Islands in September, October, December and January. Similar trends
with low significance level (<90%) are found in Russian Primorye region for most months ( Krokhin, 2001).
Significant positive precipitation trend occurs in Kyushu and Honshu Islands:
centennial trend in May, semi-centennial in March (Fig.2a). In the subarctic zone (Hokkaido, Sapporo)
centennial increase of precipitation with high significance level (95-99%) occurs in January, February,
March and August, and decrease of precipitation occurs in May, June and July. Thus, seasonality of precipitation
trend over Japanese Islands is significant, and shows opposite patterns of trend in subtropic and subarctic
zones. It can be conditioned by storm track change like in ENSO signal and decadal oscillation ( Nakamura et al., 1997). Trends estimated by Nonparametric Robust (NR) method are more objective with greater
reliability than LS method in case of precipitations. About 50% of precipitation time series even for
whole period of instrumental observation has abnormal distribution function usually with substantial positive
skewness and sometimes an abnormal kurtosis. Difference between statistical significance of centennial
precipitation trends in Japan estimated by NR and LS methods is demonstrated in Figure 3.
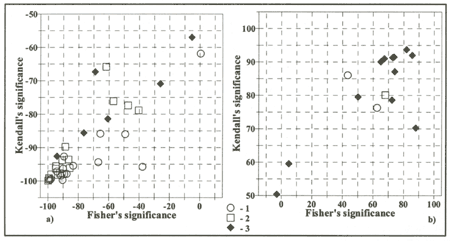 Figure 3. Statistical significance level (%) of negative (a) and positive
(b) centennial (1900-2000) trends of monthly precipitation in Japan for October (1), December (2), and
May (3) estimated by LS method with Fisher's test and by NR method with Kendal's test for significance
level. A negative value of in axis (a) means negative trend.
The principal difference and similarity between trend and its significance estimated by two methods depends on distribution function, mainly, on its skewness and kurtosis. Statistical significance of precipitation trends determined by NR method is higher, than that calculated by LS method in all cases of abnormal skewness and kurtosis in distribution function.
|