5. References
Council Regulation (EC) No 1540/98 of 29 June 1998
Official Journal L 202, 18/07/1998 p. 0001-0010
Communication from the Commission to the Council, the European Parliament, the Economic and
Social Committee and the Committee of the Regions - "Towards a new shipbuilding policy"
COM/97/0470 final
The OECD "Agreement Respecting Normal Competitive Conditions in the Commercial Shipbuilding and Repair Industry", 21 December 1994
First Marine International, Shipbuilding Market Monitoring
Reports for the European Commission (not published):
Monthly market reports (April, May, June, July, August 1999)
Background cost information reports I and II
Cost evaluation reports I, II and III
Mid-term report
Details of cost model used
The cost model employed for the shipbuilding market monitoring study (see chapter 3) distinguishes between the following items:
■ Material costs (steel, engine and propulsion system, auxiliary engines, automation and control equipment, cargo handling and cargo treatment equipment, specialised equipment, etc.);
■ Labour costs (engineering, administration, management and production) both in-house and concerning sub-contractors;
■ Financing costs including guarantees, etc.;
■ Other direct costs such as classification costs, risk insurance, warranty reserve, commissions, etc..
The estimate of material and equipment costs in the cost model is based on an estimate of costs within the EU, and applying a variation factor which takes account of the fact that material and equipment prices are lower for Asian competitors. This has been accomplished by undertaking a survey of over 100 equipment manufacturers within Europe who are competing against domestic suppliers in Asia for contracts in Asian yards. In each of the categories the prices offered by South Korean manufacturers to domestic buyers were found to be approximately 25% lower than the equivalent price in the European industry. This competitive advantage is taken into consideration in the model.
The analysis of wages is based on officially published statistics. In the case of South Korea there has been much talk of wage cuts since the economic crisis. The cost model evaluates the actual extent of this fall in wages. The conclusions drawn from this analysis are that whilst there was, as expected, a decrease in wages in 1998 over 1997, following the economic difficulties, the decrease was fairly low and was certainly lower than press reports of 50% wage cuts (and more) have suggested. It also appears from the statistics analysed that there has been little resolve to maintain lower wages, with the recovery in earnings heralded by the very large bonus payment at the end of 1998, following a year of restraint. Further analysis has been carried out to take into account the effect of exchange rate changes on the level of earnings expressed in US Dollars. Dollar equivalent earnings fell by almost 50% between October 1997 and February 1998 but have been rising since that time. Taking into account the average over the period February to December, dollar denominated earnings fell by 34% between 1997 and 1998. The average for first quarter 1999 was around 20% below the same period in 1997.
Assumptions on total working hours are also based on official statistics, complemented with a specific adaptation of the figures to the shipbuilding industry. The same approach is used to evaluate the overall productivity of Asian shipyards, taking industrial productivity in general as a basis and adapting it to the specific situation of each yard under investigation. Productivity is expressed as man-hours needed to produce one cgt at the facility in question.
Direct financing costs included are those for the working capital for the contract and those for the repayment guarantees. The contribution that each order has to make to the debt servicing of the building yard (if there are debts to be serviced) is included under indirect costs. However, where yards received debt forgiveness, these debts are no longer considered.
For each selected order the items mentioned above are specified and complemented with assumptions on indirect costs such as overhead, yard-specific amortisation of shipbuilding equipment and profit margin. It is obvious that many elements in the cost model can only be specified through in-depth knowledge of the particular ship on order and the building yard. The analyses are continuously updated as soon as additional information becomes available.
Details of investigated shipyards
A. Case of Halla shipyard
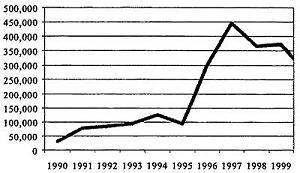
Shipbuilding operations at Halla were transferred from the original site in Inchon to a purpose-built new facility in Mokpo, known as Samho, in 1996. The new Samho shipbuilding facility, operated by Halla Heavy Engineering (HHE) boosted the capacity of the shipyard by around four times, and Halla now ranks the 5th largest shipbuilder in the world. The average output from Samho in the three years since it became fully operational (operations commenced in 1996) has been 430.546 cgt (including expected output in 1999). The output from Halla (including Inchon and Samho) in terms of cgt by year is illustrated in the following chart.
Fig. 6 Development of Halla's shipbuilding output (cgt), 1990-1999
The boost in output following the hand-over from Inchon to Samho in 1996 is clearly visible from this chart. The yard has been troubled since its opening, suffering from problems of design of the facility, and from its location on the East Coast of the country, away from the main areas of shipbuilding employment at Ulsan and Busan. Soon after becoming operational it was clear that the design of the yard was inadequate to achieve the steel throughput needed to meet the capacity target. The inadequate design of the facility leads to performance penalties which are further increased by the dated systems installed in the yard to support production. Performance also suffers because of the location of the shipyard. Higher wages than paid by other shipbuilders have had to be offered to attract workers to the region, and the quality of workers employed is not thought to be as high as found in other main shipyards in South Korea.
In December 1997, South Korea sustained one of its largest corporate failures with the collapse of the Halla Group. Halla has since survived with intensive financial restructuring. This has included one of the most important component parts of the group, the shipbuilding subsidiary HHE. Despite bankruptcy the shipyard is still operating with the support of its creditors (with Korea Exchange Bank as the main creditor). Support has taken two primary forms, debt forgiveness and bridging finance from the international finance markets.
HHE has been generating a net loss in 1996, 1997 and 1998 (the period after Inchon closed and operations were moved to Samho). The shipyard has failed to make even an operating profit. The accounts indicate that Halla has been pricing contracts at a level which does not cover direct cost of sales, let alone contribute to selling and administrative expenses and other costs, notably the cost of financing the new facility. The level of these operating losses is very high, at 17,5% of sales in 1997 and 29,5% of sales in 1998. This strongly suggests that the level of pricing was very significantly below costs and that the company has a very fundamental problem in operational terms.
Since December 1997 HHE has been under court management, a form of official receivership. It has continued to compete for shipbuilding work in the international markets. Various reported shipbuilding contracts at extremely low prices have aroused a hostile reaction from competitors on the grounds that the company has received illegal finance. These contract prices are well below the international average, and based on the trading history of the company there is a very legitimate concern that the company may be continuing to take orders at a loss-making level, in the face of an urgent need for orders to utilise capacity from next year onwards.
In November 1998, Halla announced that the creditors of HHE had agreed to write-off up to 52% of the company' s collateralised debt and 78% of unsecured debt. In addition, interest charges were waived from much of the remaining debt. The debt reduction amounted to 978 Billion Won (742 Million US Dollars). The overall debt amounted to 3,6 Trillion Won at the time. Most of the financial creditors of HHE were major domestic banks in South Korea who collectively had sourced funds on the international markets for economic stabilisation.
The rescue package for HHE has caused considerable controversy not only because of the size of the funding required, but also because many of the company' s debt problems originate from the construction cost of the new facilities in the early 1990s. Further concern has been expressed on the continuation of KEXIM bank to offer guarantees to Halla which is in effect bankrupt, and which in a normal commercial sense would not be available. KEXIM argues that it charges a premium to take this into account, although it is unlikely that a company such as Halla would be able to attract such guarantees in a purely commercial situation.
Due to the serious problems at Halla all efforts to sell the yard have so far failed. Hyundai which was rumoured to be interested in the yard has frequently denied this, but seems now to have agreed to take over Halla's management and send 150 top executives to help in the reorganisation of the yard. At the same time another debt moratorium has allegedly been agreed. Given the prominent role that state-controlled banks play with regard to Halla, providing finance and participating in the debt write-offs and moratoria, these developments require further scrutiny, as far as possible government intervention is concerned.
As the cases of Daedong and Daewoo show a similar patterns as Halla a few words need to be said about these two shipyards.
B. Case of Daedong Shipbuilding Co.
Daedong Shipbuilding Co Ltd is a private limited company, registered in South Korea in 1967.
Daedong is solely involved in shipbuilding. Its main construction site moved from Pusan to a brand new shipyard at Chinhae, 40 miles down the coast from Pusan, in 1996. As of February 1997, Daedong has been operating under a court protection plan. Daedong is currently trading under a corporate reorganisation package approved by the courts. Between February and October 1997 the company operated under the direction of a court-appointed receiver, who put together a restructuring package which aims to enable Daedong to pay back creditors over an agreed period of time and the yard to carry on trading. This plan was accepted by the courts in October 1997, and permitted the company to continue operating in receivership. The company' s main creditors finally approved the rescheduling of the debt in August 1998 (Daedong's total debts are ca. 204 Mio. USD). Under the reorganisation plan Daedong has agreed to repay its debts over a period of 14 years (1998-2012) at an interest rate of 7%to 8%, and it has been granted a moratorium on repayments until 2003. Until then, the company will have to pay interest on its debts, but will not be required to repay any of the principal. Although Korea emphasises that the rescue measures for Daedong were taken by independent private creditors , it is at least questionable whether these measures are compatible with the market oriented practices Korea has committed itself to in the context of the IMF reform programme.
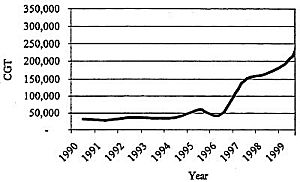
Daedong' s original shipyard in Pusan specialised in the construction of chemical tankers, product tankers and mini-bulkers up to 10.000 tonnes deadweight. Daedong' s new yard opened in June 1996, and the new capacity effectively replaced the existing capacity at the Pusan yard.
Output from the two yards since 1990 is presented in the following graph.
Fig. 7 Development of Daedong's shipbuilding output (cgt), 1990-1999
The boost in capacity following the opening of the new yard in 1997 is clear from this chart. Output has increased from a steady level of around 50.000 cgt per annum in the old yard to in excess of 300.000 cgt on order for delivery in 2000.
After all the problems encountered during 1997 Daedong achieved relatively strong results in 1998.
Sales were increased by 32%, while direct costs were better controlled and rose less steeply, to allow gross profits to be doubled. The company's 1997/1998 balance sheet shows that, although the long-term debt total was virtually doubled, the short-term debt was sharply reduced. It should be noted that Korean interest rates fluctuated greatly during the course of 1998 with a fall in commercial paper rates from 23% in the first quarter to 8% in the last quarter. These movements are likely to have contributed to the reduction in interest charges for the year. However, a Daedong management spokesman has indicated that when the banks approved the debt rescheduling in August 1998, they reduced their interest rates. If this is the case, it raises the question why banks have abandoned market-oriented lending practices.
C. Case of Daewoo Heavy Industries
The Daewoo Group is one of Korea' s top 5 conglomerates or chaebol. It is active in a wide range of business sectors, including electronics, shipbuilding, automotive, construction, trading and financial services. The group is headed by the publicly quoted Daewoo Corporation, which was formed in 1967 by its current Chairman, Mr Kim Woo-choong. Apart from its role as parent company, Daewoo Corporation manages the group's construction and trading activities.
As part of the general Korean government attempt to induce a reorganisation of the chaebols'businesses, Daewoo is currently in the midst of a major divestment programme aimed at selling 31 of its 41 group companies by early 2000. The chaebols seem to be responding to the enforced change with varying degrees of enthusiasm and most are reluctant to sell off profitable businesses. Nevertheless, Daewoo's own programme has been given a much greater urgency as it has become increasingly clear that the group is teetering on the edge of bankruptcy. The Korean government is acutely aware that it cannot afford a failure on this scale for the sake of the economy as a whole. The short-term debt was originally due for repayment at the end of July but it has been reported that the bankers have agreed to roll over the debt for another six months. The new funds will replace debts called in by creditors in the last couple of months. At the same time, the creditor banks will be able to dispose of the collateral in any way they see fit if the group does not keep to its restructuring targets. The Korean government has commissioned Arthur Andersen to oversee the restructuring in an attempt to show that the plan will be executed fairly.
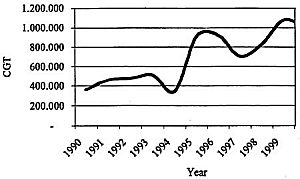
In addition to the group reorganisation, Daewoo Heavy Industries (DHI) under which the shipyard operates, is itself restructuring. It is reported that it is selling off various business units and real estate, and the sale of its car division to Daewoo Motor was the key to it being able to increase its net profits in 1998. DHI is regarded as fundamentally one of the most profitable parts of the group. DHI has in the meantime come under control of local banks, but the question of collaterals is still being discussed. The shipbuilding division of DHI operates two shipyards: the Okpo Shipyard in South Korea and the Mangalia Shipyard in Romania. The Okpo yard is active not only in shipbuilding but also in repair and conversion, and production of offshore platforms, drilling rigs and industrial plants. The Mangalia yard specialises in repairs and conversions. Output since 1990 is presented in the following chart.
Fig. 8 Development of DHI's shipbuilding output (cgt), 1990-1999
The latest accounts of DHI to be published are for the year ended 31 December 1998. Whilst improved pre-tax and net profits might suggest a steady improvement in the company's performance during 1998, a closer inspection reveals that this is too simplistic an interpretation. Despite an 11% climb in sales, this was outstripped by the increases in both direct sales costs and overhead costs, resulting in a decrease in profits at gross and operating levels.
There is little hard information available regarding DHI' s specific debt repayment plans. As stated, the company' s gearing at the end of 1998 can be considered quite healthy when compared with the current average for Korean shipyards. Nevertheless, much of the Daewoo group' s future appears uncertain at present and there are disturbing reports that the Financial Supervisory Commission of South Korea has decided to soften the rules for Daewoo's domestic creditor banks, basically exempting them from domestic regulations governing lending practices and allowing them to add non-performing loans during Daewoo's restructuring process.
Data for Fig. 1: Completed ships 1985-1998, supply and demand forecasts by AWES/SAJ and KSA, in Mio. cgt
| Year |
1985 |
1986 |
1987 |
1988 |
1989 |
1990 |
| Completed ships 1985-1998 |
14,20 |
12,10 |
9,20 |
8,50 |
9,30 |
11,50 |
| Demand forecast AWES/SAJ 1999-2010 |
|
|
|
|
|
|
| Demand forecast KSA 2001-2005 |
|
|
|
|
|
|
| Supply forecast AWES/SAJ 2000-2005 |
|
|
|
|
|
|
| Supply forecast KSA 2000-2005 |
|
|
|
|
|
|
| |
|
|
|
|
|
|
| Year (cont.) |
1991 |
1992 |
1993 |
1994 |
1995 |
1996 |
| Completed ships 1985-1998 |
11,40 |
12,10 |
12,40 |
12,50 |
14,40 |
16,70 |
| Demand forecast AWES/SAJ 1999-2010 |
|
|
|
|
|
|
| Demand forecast KSA 2001-2005 |
|
|
|
|
|
|
| Supply forecast AWES/SAJ 2000-2005 |
|
|
|
|
|
|
| Supply forecast KSA 2000-2005 |
|
|
|
|
|
|
| |
|
|
|
|
|
|
| Year (cont.) |
1997 |
1998 |
1999 |
2000 |
2001 |
2002 |
| Completed ships 1985-1998 |
16,90 |
18,00 |
|
|
|
|
| Demand forecast AWES/SAJ 1999-2010 |
|
|
15,60 |
15,60 |
15,60 |
15,60 |
| Demand forecast KSA 2001-2005* |
|
|
|
|
16,80 |
16,80 |
| Supply forecast AWES/SAJ 2000-2005 |
|
|
|
21,14 |
21,66 |
22,18 |
| Supply forecast KSA 2000-2005* |
|
|
|
16,79 |
17,08 |
17,38 |
| |
|
|
|
|
|
|
| Year (cont.) |
2003 |
2004 |
2005 |
2006 |
2007 |
2008 |
| Completed ships 1985-1998 |
|
|
|
|
|
|
| Demand forecast AWES/SAJ 1999-2010 |
15,60 |
15,60 |
16,49 |
17,38 |
17,38 |
17,38 |
| Demand forecast KSA 2001-2005* |
16,80 |
16,80 |
16,80 |
|
|
|
| Supply forecast AWES/SAJ 2000-2005 |
22,69 |
23,21 |
23,73 |
|
|
|
| Supply forecast KSA 2000-2005* |
17,68 |
17,98 |
18,27 |
|
|
|
| |
|
|
|
|
|
|
| Year (cont.) |
2009 |
2010 |
|
|
|
|
| Completed ships 1985-1998 |
|
|
|
|
|
|
| Demand forecast AWES/SAJ 1999-2010 |
17,38 |
17,38 |
|
|
|
|
| Demand forecast KSA 2001-2005 |
|
|
|
|
|
|
| Supply forecast AWES/SAJ 2000-2005 |
|
|
|
|
|
|
| Supply forecast KSA 2000-2005 |
|
|
|
|
|
|
* Due to lack of cgt data the KSA forecasts were re-calculated from completed gross tonnes applying a conversion factor.(1 gt= 1,6 cgt)
Source: OECD and European Commission
Data for Fig. 2: Construction capacities in Japan, Korea and the EU, cgt*103
| Year |
1988 |
1989 |
1990 |
1991 |
1992 |
1993 |
1994 |
1995 |
1996 |
1997 |
| EU |
4400 |
3684 |
3783 |
3311 |
3489 |
3264 |
3285 |
3168 |
3168 |
3168 |
| JAPAN |
5600 |
5600 |
5600 |
5600 |
5600 |
5600 |
5600 |
5600 |
5600 |
5600 |
| S. KOREA** |
1671 |
1633 |
1821 |
1841 |
2648 |
2437 |
2270 |
3619 |
4307 |
4648 |
** Due to lack of cgt data the figures for South Korea were calculated from completed gross tonnes, using OECD data and applying conversion factors that reflect the evolution in the product mix of Korean yards.
(1988-1991: 1 gt = 1,9 cgt; 1992-1994: 1 gt = 1,8 cgt; 1995-1997: 1 gt = 1,7 cgt)
Source: OECD, Lloyd's Register of Shipping and European Commission
N.B.: Figures are based on national statistics using partly different definitions.
Data for Fig. 3: World market shares by country/region, 1997, 1998 and 1st half of 1999, cgt and percent, orders
| |
1997 |
1998 |
1. half 1999 |
| cgt*103 |
share in % |
cgt*103 |
share in % |
cgt*103 |
share in % |
| EU |
2950,4 |
14,09% |
4513,3 |
24,58% |
1346,3 |
17,13% |
| REST OF AWES |
473,1 |
2,26% |
725,7 |
3,95% |
332,5 |
4,23% |
| JAPAN |
7930,4 |
37,88% |
5741,8 |
31,28% |
2228,5 |
28,35% |
| SOUTH KOREA |
6115,9 |
29,21% |
4486,8 |
24,44% |
2272,4 |
28,91% |
| USA |
331,4 |
1,58% |
345,6 |
1,88% |
324,3 |
4,13% |
| OTHER |
3133,8 |
14,97% |
2545,8 |
13,87% |
1356,2 |
17,25% |
| GRAND TOTAL |
20935,0 |
100,00% |
18359,0 |
100,00% |
7860,2 |
100,00% |
Source: Lloyd's Register of Shipping and European Commission
Additional data: World market shares by country/region, 1997,1998 and 1st half of 1999, cgt and percent, completed
| |
1997 |
1998 |
1. half 1999 |
| cgt*103 |
share in % |
cgt*103 |
share in % |
cgt*103 |
share in % |
| EU |
3246,4 |
19,09% |
3585,7 |
19,92% |
1345,2 |
15,18% |
| REST OF AWES |
784,2 |
4,61% |
881,4 |
4,90% |
365,6 |
4,13% |
| JAPAN |
6294,9 |
37,01% |
6834,4 |
37,96% |
3363,3 |
37,96% |
| SOUTH KOREA |
4053,3 |
28,83% |
3656,2 |
20,31% |
2426,9 |
27,39% |
| USA |
129,0 |
0,76% |
360,4 |
2,00% |
157,3 |
1,78% |
| OTHER |
2501,5 |
14,71% |
2686,0 |
14,92% |
1202,9 |
13,57% |
| GRAND TOTAL |
17009,3 |
100,00% |
18004,1 |
100,00% |
8861,2 |
100,00% |
Source: Lloyd's Register of Shipping and European Commission
Data for Fig. 4: World market shares by shiptype, 1998, cgt and percent(orders)
| |
cgt*103 |
share in % |
| CRUDE OIL TANKERS |
2688,7 |
14,65% |
| PRODUCT AND CHEMICAL CARRIERS |
1646,7 |
8,97% |
| BULK CARRIERS |
2548,3 |
13,88% |
| GENERAL CARGO SHIPS |
1969,9 |
10,73% |
| FULL CONTAINER HIGH SPEED LINER |
3163,4 |
17,23% |
| Ro-Ro VESSELS |
441,4 |
2,40% |
| CAR CARRIERS |
780,2 |
4,25% |
| GAS CARRIERS |
637,8 |
3,47% |
| FERRIES |
553,2 |
3,01% |
| PASSENGER SHIPS |
1632,2 |
8,89% |
| FISHING VESSELS |
336,2 |
1,83% |
| OTHER NON CARGO VESSELS |
1692,7 |
9,22% |
| OTHER VESSELS |
268,3 |
1,46% |
| GRAND TOTAL |
18359 |
100,00% |
Source: Lloyd's Register of Shipping and European Commission
Data for Fig. 5: Market shares of Japan, South Korea and the EU in container vessels(orders, based on cgt), 1997, 1998 and first half of 1999
| |
1997 |
1998 |
1st half of 1999 |
| cgt*103 |
share in % |
cgt*103 |
share in % |
cgt*103 |
share in % |
| EU |
581,8 |
23,92% |
485,2 |
15,34% |
164,0 |
14,63% |
| SOUTH KOREA |
368,3 |
15,14% |
1395,1 |
44,10% |
765,1 |
68,25% |
| JAPAN |
1085,2 |
44,62% |
672,7 |
21,27% |
99,0 |
8,83% |
| OTHERS |
397,0 |
16,32% |
610,4 |
19,29% |
92,9 |
8,29% |
| WORLD TOTAL |
2432,3 |
100% |
3163,4 |
100% |
1121,0 |
100% |
Source: Lloyd's Register of Shipping and European Commission