World Fleet Developments
According to ISL data, as of January 2000, the world merchant fleet of ships over 300 gross tons stood at 38,917 ocean-going ships totaling 761.9 million deadweight tons and a TEU capacity of 6.3 million. In terms of breakdown by ship type in Figure 5, it is not surprising to see tankers dominating with over 40 percent of the world's merchant tonnage, since it represents an approximate reflection of the seaborne trade volumes by commodities seen in Figure 1.
Figure 5: Breakdown of World's Merchant Fleet by Tonnage
| Ship Type |
% Share of World Total |
|
Tanker |
42 |
|
Bulk Carrier |
36 |
|
General Cargo |
13 |
|
Container |
8 |
|
Passenger |
1 |
|
Total |
100 |
Source: ISL
In terms of ownership by tonnage, the regional grouping of countries of domicile indicates that at the beginning of 2000 at least 45 percent of the world's fleet were attributable to European-owned parent companies. Asian and Oceanian shipowners had a 40 percent share, followed by North American owners with less than 10 percent share. By country of domicile, a slightly different picture emerges with Japan number one with a 12.3% share, followed by Greece(10.5%), the United States(5.3%), Norway(5.1%), and Singapore(4.8%).
In terms of flying the flag, open registries or more commonly known as "flags of convenience" dominate the world's merchant tonnage. The top four along with number six Cyprus are commonly known in shipping circles as the "Big 5" in open registries. The Big 5 have about 45 percent of the world's merchant tonnage under their jurisdiction as flag states. What is significant about the ranking is that the flag no longer bears any relationship to economic power.
Figure 6: Top 10 Flags by Deadweight Tons(DWT)(As of January 2000)
| Flag of Country |
% Share of World Total |
|
1. Panama |
20.9 |
|
2. Liberia |
10.1 |
|
3. Malta |
5.9 |
|
4. Bahamas |
5.8 |
|
5. Greece |
5.4 |
|
6. Cyprus |
4.6 |
|
7. Singapore |
4.4 |
|
8. Norway (NIS)* |
3.7 |
|
9. China |
2.8 |
|
10. Japan |
2.2 |
*Second registry for Norway(not true national registry)
Source: U.S. Maritime Administration
De-Nationalization of the World's Merchant Fleet
As Figure 6 vividly demonstrates, a wholesale de-nationalization
of the world's merchant fleet is almost complete. What happened? Throughout history,
merchant ships served as economic plenipotentiaries in international commerce.
With rare and often transitory exceptions, nationality of the ownership in the
vessel, cargo, and crew were inseparable from the ship's flag. In the post-WWII
era, the growing internationalization of trade combined with widespread de-colonization
forced shipping to become increasingly divorced from direct national control,
and this has had an adverse effect on the relative importance of the fleets of
the traditional maritime nations. Today, the ship's flag more often than not gives
no indication of the nationality of the controlling interests behind the vessel.
In fact, more than 60 percent of the world's merchant vessels fly a flag that
is different than the nationality of the owner.
xii
This remarkable shift can be captured below in Figure 7. What is interesting is the domination by the national flags of the great powers in 1975. Today, only one remains in the top 10 -- Japan. Instead the list is dominated by open registers, better known as "flags of convenience"(FOC).
Figure 7: Top 10 Country Flags by Deadweight Tons (DWT)
| 1975 |
|
2000 |
| Liberia |
1 |
Panama |
| Japan |
2 |
Liberia |
| United Kingdom |
3 |
Malta |
| Norway |
4 |
Bahamas |
| Greece |
5 |
Greece |
| Panama |
6 |
Cyprus |
| France |
7 |
Singapore |
| United States |
8 |
Norway (NIS) |
|
Italy |
9 |
China |
| Former Soviet Union |
10 |
Japan |
Note: Countries in Italics represent flags of convenience
Source: U.S. Maritime Administration
The flags of Liberia, Panama, Cyprus, and Malta are considered "open" in that they are non-discriminatory on the basis of ownership nationality. National flags like Greece, China, and Japan are more restrictive; those who opt to fly the flag must often provide proof of citizenship or residence that corresponds to that flag. Flags like Singapore and Norway fall somewhere in between as they are less stringent in terms of ownership requirements, but are more onerous in regulatory affairs than open registries.
Why has the shift occurred on such a dramatic scale? Since shipowners operate in a free-market environment, competitiveness becomes the rule of the game. In order to compete effectively, shipowners seek to cut costs or streamline operations wherever possible, and many have found the answers in flags of convenience. The advantages such FOCs offer in comparison to national flags include the following:
・ Anonymity of ownership;
・ Lower crew costs;
・ Simple registration procedures;
・ Less stringent regulations;
・ No obvious weighting of insurance premiums or finances;
・ Little to no corporation tax on profits from shipping; and
・ Diffusion of liability.
Such advantages have proved overwhelming that
virtually all nations bemoan the fact that much of their foreign trade is carried
in ships flying flags other than their own. In fact, there is not a single nation
that carries the majority of their foreign trade in ocean-going ships flying their
respective national flag. From a random sampling of countries in Figure 8, one
can see further evidence of the denationalization of shipping. Even the mighty
Union Jack is not immuned from this trend. In 1914 the UK-owned fleet was 42 percent
of the world's total in term of tonnage; today, it is less than two percent.
xiii
Figure 8: Countries' Share of Foreign Trade Carried by Its National Flag Ships
| Country |
% of Foreign Trade
Carried by its National Flag Ships |
|
United States |
5 |
|
Russia |
6 |
|
India |
30 |
|
Indonesia |
3 |
|
Brazil |
5 |
|
Nigeria |
1 |
Source: Various: U.S. Marad, Lloyd's List, Fairplay, Lloyd's Maritime Information Services
Transnational Influences
Transnational corporations are the single biggest
influence on the patterns of international trade. They generate about two-thirds
of world trade by value. A third of that involves intra-company exports by the
parent companies and their foreign affiliates.
xiv
Mergeglobal estimates that at least 40 percent of the east/west trade, mainly
between the United States, Europe, and Asia consists of intra-company shipments.
xv
As the UNCTAD Secretary-General Rubens Ricupero stresses, “International production
- numbering some 63,000 today, with approximately 700,000 foreign affiliates -
now spans virtually all countries and economic activities, rendering it a formidable
force in today's world economy.”
xvi
In the last 10 years, the globalization of industry
and commerce has resulted in many multinational mergers in the telecommunications,
automobile, aircraft, food processing, general manufacturing, and oil industries.
The value of worldwide company mergers now approaches $1 trillion per year, compared
with less than $50 billion just a decade ago, and is still growing. This phenomenal
growth has generated huge demands for global logistics requirements, as most of
the mergers are global and require establishment of well-coordinated global transport
or logistics networks to serve the diverse component industries and supplier network
of the merged company. In container shipping, over 30 percent of the intercontinental
containers are now shipped by transnational or global corporations with sales
of more than $8 billion. By 2010, this percentage is expected to grow to 70 percent.
xvii
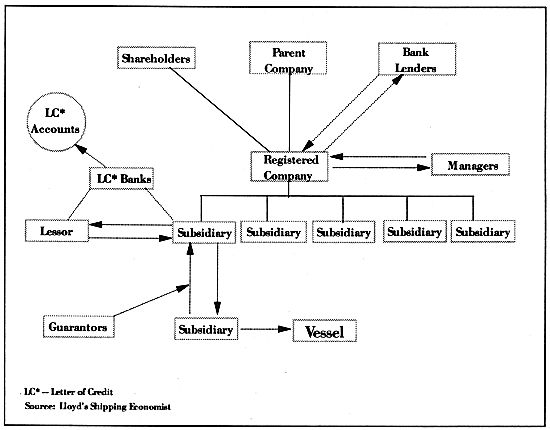
The transnational influences also extend to the shipping industry itself. Figure 9 below represents a model of an ownership structure based on a recent initial public offering(IPO)for shares in an oil tanker company.
Figure 9: Vessel Ownership Structure
(拡大画面: 35 KB)
In this example, the parent company based in the Netherlands decided to create a separate company in Bermuda under a different name and delegate management responsibilities to another company in Sweden. This bewildering complex web of interests is rapidly becoming the norm in the shipping industry for the following reasons:
・ Borderless finance;
・ Increased capital requirements for shipbuilding;
・ Pressures to reduce costs and evade stringent regulations; and
・ Expanding global economic and trade relationships.
When you add to the mix about 40,000 merchant ships plying the world's oceans and flying over 200 separate flags today, the challenges are enormous for policymakers and naval planners in determining the multiple interests in a single ship; in short, separating friend from foe. Finding out "who's in charge" of both the ship and cargo can often take months of legal inquiry. This blurring of interests behind the ship and its cargo translates into a sobering reality for navies: interdiction of a ship in international waters creates an impact far beyond the flag its flies. The challenge then becomes how to determine precisely who is being affected and on whom may they call for assistance.
Introduction of Containerization
Since the first container ship crossed the Atlantic
in May 1966, world trade has come to be dominated by the containerized freight.
The ubiquitous container now accounts for 60 percent of the world's trade by value,
and is expected to reach 70 percent by 2010. The container's success has been
due to its ease of handling and the protection it offers against damage and theft.
One crane operator can load and unload cargoes that would have taken an army of
dockworkers in the 1950s. Port turnaround times of vessels have been reduced from
three weeks to less than 24 hours.
xviii
This greater efficiency has dramatically reduced
the cost of shipping. Before the arrival of the container, the cost of sea freight
was typically 5 to 10 percent of the value of the retail price. Now a $6,000 motorcycle
can be shipped on an intercontinental journey for $85, 1.5 percent of its value,
and a $1 can of beer for one cent.
xix
World trade and globalization have been facilitated by containerization, as evidenced by the following trends:
◆ Shift from Ocean Carrier to Total Logistics System -- The carriers' strategy has shifted from a port-to-port to a door-to-door focus. The container made this shift possible by virtue of its interchangeability among the various modes of transport(road, rail, sea), giving birth to the term, "intermodalism." Containers packed with goods at the point-of-production can be transported over water and land without ever being opened until they reach their point-of-sale of final destination, creating a secure, seamless flow of goods from the manufacturer to the retailer.
◆ Greater Concentration of Trade Flows -- The worldwide spread of containerization has led to traditional commodities like raw cotton, sugar, woodpulp, waste paper, raw timber, and even grain to become increasingly containerized. The growth has been phenomenal with no signs of abating as illustrated in Figure 2. Consequently, once specialized trade flows carrying specific commodities to ports with general cargo-handling facilities are gradually merging to form a steady stream of containers to ports equipped only to handle containers. For bulk commodities like iron ore, coal, and crude oil, there is less concentration due to geographical diversity of supplies.
◆ Globalization of Production Facilities -- Manufacturing is becoming a process of bringing together and assembling raw materials, parts and semi-finished products from all over the world. Only final assembly adjustments are carried out in local markets. To imagine the scale of this complexity, take the automotive giant, Ford, for example:
Ford owns 154 factories worldwide. Of these, 58
are "vehicle operations" plants which make tools/dies, fabricate body frames and
stampings and actually assemble vehicles. Then there are 55 "powertrain plants"
making castings, forgings, transmissions, chassis and engines. A further 41 plants
make "automotive components", i.e., body trim, glass, fuel systems, electronics,
climate control equipment and plastic items. Then there are another 30 joint-venture
plants(mainly Asia)making a whole range of items. Many of these plants' outputs
must be moved to other plants as the production processes progress. In addition,
the plethora of "vendor" components -- brought in from outside suppliers -- have
to get to where they are needed.
xx
This is not just limited to Ford and automobiles.
Nike, the venerable athletic shoe-maker, has a similar degree of complexity. For
example, the Air Max Penny shoe, named for NBA basketball star Anfernee "Penny"
Hardaway, is made up of 52 different components coming from five different countries.
xxi
Not only do all the materials have to come together they have to come together
at the right time. The flexibility of container movements makes this possible.
◆ The Rise of Supply Chain Management as a Discipline
- With the container offering visibility in the cargo pipeline, the constant need
to reduce inventory investment and speed products to the market have prompted
companies to focus on supply logistics in their quest for a competitive edge.
Future emphasis will center on consumers choosing to view how a product gets delivered
as an actual part of what they are buying, based on the theory that as goods move
faster, then the logistics directly affect the value and overall buyer appeal
rises. In this instance, speed and selection can become more important than price.
As a consequence, many companies are shifting logistics strategies from "operational
effectiveness" to one of customer "value maximization."
xxii
The compounding effect of these trends has unwittingly created a global "just-in-time(JIT)" transport system that is highly susceptible to either electronic or physical means of interruption. Moreover, as global competition accelerates, the "excess" margin is likely to diminish in the overall transportation system. This, of course, constrains the flexibility of logistics planners to respond to sudden and unanticipated events. While the JIT philosophy may be good for the bottom line, it does not place a premium on contingency planning. This is a concern that neither the commercial nor the military world has adequately addressed.