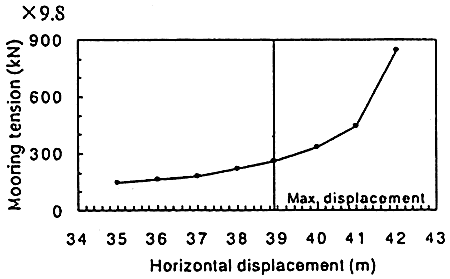
Figure 5 Characteristics of mooring line.
Also, the anchors had steel pipes to enhance their holding power.
2.5 Measurement and Control System
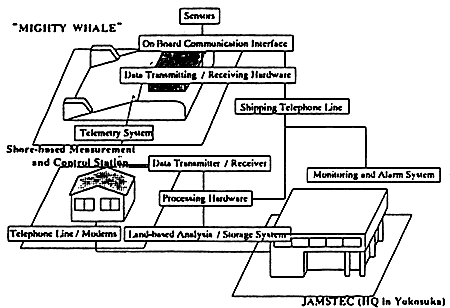
The prototype is an unmanned floating platform, and is set up to operate automatically. The shore-based measurement and control station is linked to device by a telemetry system. Measurement of device performance, and parameters monitoring on-board equipment and the device as a whole are all transmitted to shore. Figure 6 shows schematic of the measurement and control system.

Figure 6 Schematic of the measurement and control system
The measurement and control system on board the prototype records atmospheric and oceanic parameters, hull oscillations, mooring forces, water displacements in and out of the air chambers, turbine/generator, rpm, torque, etc. Almost all of the measured data can be analyzed on board. Parameters corresponding to device safety and overall equipment operation are monitored from the shore-based measurement and control station. Monitoring, control, and intervention from the shore are made possible by the telemetry system.
2.6 Test Site
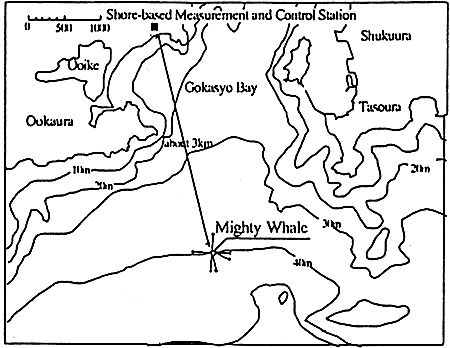
A map of the test site (Gokasho Bay Nansei Town Watarai District, Mic Prefecture) is shown in Figure 7. The prototype is to be stationed about 1.5km from the bay entrance, at a depth of about 40m. In August 1996, JAMSTEC carried out a survey over a 1km2 around the planned test point. The survey indicated a North-South bottom gradient of 1:100, and a depth range of 34-44m. Further, it was also found that except for a small region, the sea-bottom in this area is 94% sandy particulate in composition.
The observed wave directions are SE-SSW (summer season: SE-S over 90% of the time, winter season: S-SW over 85% of the time). The 1/3 significant wave height is below 1.0m, and the 1/3 significant period is between 5.0-8.0 sec. The annual average wave power density at the site is about 4kW/m.

Figure 7 Test site
2.7 Power Output(3)
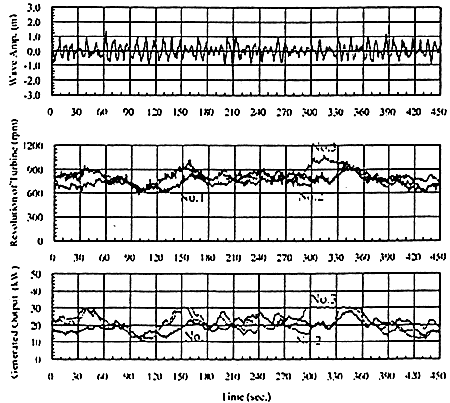
Figure 8 shows an example of time series of generating condition at 15th of March 1999 (From 13:55 to 14:02). At this time, the significant wave conditions were 1.68 m wave height, and 8.7 sec wave period. From this figure, it is seen that the average of power output is about 20 kW and turbine rotation speed is about 800 r.p.m..

Figure 8 Actual example of power generation
Figure 9 shows characteristic of average of total generated output. In this figure, each curve show characteristic corresponding to significant wave period range, it seen that it is in proportion to the square of significant wave height. And it is seen that the generating system operate efficiently ranging from 6.5 sec to 8.5 sec of wave period.
前ページ 目次へ 次ページ