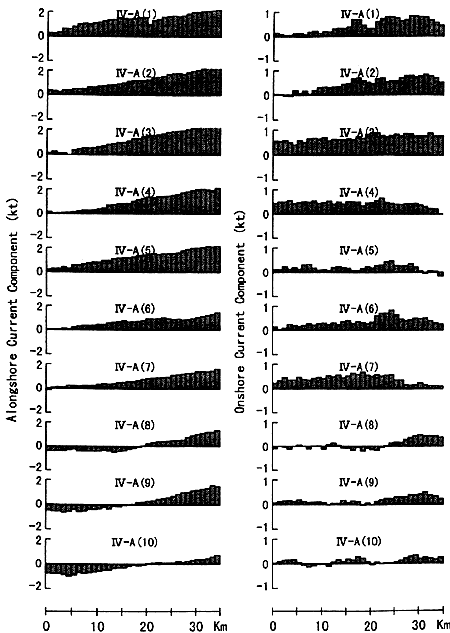
Fig.10. Same as in Fig.6 except for 10 repeated runs in Cruise IV.
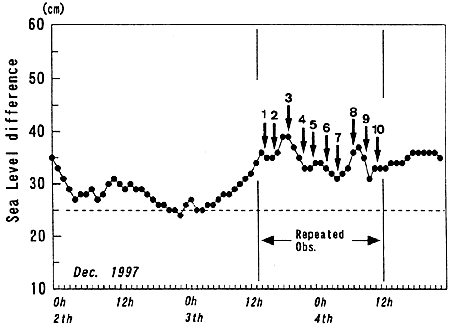
Fig.11. Same as in Fig.7 except for Cruise IV.
However, the divergent tendency of the alongshore current is clearly seen in all runs (left panel of Fig.10). In this case, the onshore component is more dominant at the time of the Eastward Current than at that of the Kii Bifurcation Current (right panel of Fig.10). Takeuchi et al. (1998a) pointed out that the Eastward Current has almost the same nature as the Bifurcation Current.
The hourly variation of the sea level difference between Kushimoto and Uragami is shown in Fig.11 for the period from December 2 to 4 together with the times of each run of Cruise IV. The sea level difference was considerably smaller than that during Cruise II and much nearer to the threshold value of 25 cm. It was very stable during the repeated observation, and seems to correspond to the stable appearance of the Kii Bifurcation Current discussed above. However, sea level difference had changed considerably before the observation: it was almost at the threshold value of 25 cm from the morning of December 2 to the morning of December 3. The Kuroshio axis might be tentatively shifted offshore for this period. The sea level difference increased during the morning of December 3, and recovered to the steady value of about 35 cm at 12:00 on December 3. It is hard to conclude anything from the limited data, but the occurrence of the Eastward Current in the earlier runs of the repeated observation might be related to a short-period fluctuation of the oceanic state near the Kii Peninsula.
5. Structure and Temporal Variation of the Kii Bifurcation Current in the Period from October 14 to 16, 1997 (Cruise III)
During the period of Cruise III (October 14-16, 1997: for details see Table 1), the sea level difference between Kushimoto and Uragami decreased from about 40 cm to a value close to the threshold value (25 cm) as shown in Fig.2. The Wakayama Prefectural Fisheries Experimental Station, in its Prompt Report on Oceanic State from Satellite Images, reported that a small-scale eddy or a small-scale meander of the Kuroshio passed just after this Cruise (the available images are not clear, and it is hard to see the passage of such a small-scale eddy solely from satellite images).
The current structures at 5 m, 25 m and 75 m are shown in Fig.12 from the multi-line observation conducted in the period from 20:05 on October 14 to 09:43 on October 16, 1997. The tendency to bifurcation was very weak along the standard line (III-A(10)), and it is seen rather in the offshore lines from III-B through III-E. The weakness of the bifurcation current might be attributed to the lower sea level difference in the later stage of the observation, which seems to reflect a temporary departure of the Kuroshio axis from Cape Shionomisaki. The temperature field at 200 m was almost uniform (not shown here) and shows no significant structure.
The current profile (5 m depth) of each repeated run is shown in Fig.13. The current profiles may be classified into the Eastward Current except III-A(5) and III-A(6) where a weak bifurcation tendency is seen.