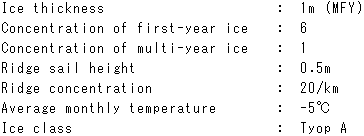
To illustrate how these formulas are used to calculate the ice index, an example is provided below.
Ice conditions

Sample calculation
IA=1×6+1×(−3.5)×1+2×(10−6−1)=8.5
Cr=0.5×20 / 5=2.0
IB=−2×2.0 / 10×(6+1)=−2.8
IC=0×6+0×1=0.0
I=IA+IB+IC=8.5−2.8+0.0=5.7
Next the correlation between ice index and ship speed was calculated for each ship type. Obviously, calculating this correlation for all combinations of segment, year and month in the data provided by AARI would be prohibitively time-consuming. Instead, a selection of appropriate combinations were made and a ship speed code called NEWSIM2 was used to derive the ship speeds. First, the minimum, mean and maximum were derived for the environmental parameters 2, 3, 7, 14 and 16 selected to use for the simulations and listed in Table C-1. Combinations of these parameters were used to cover the range where the ice index could be obtained. Minimum and maximum were calculated as minimum = mean - standard deviation and maximum = mean + standard deviation; these values are shown in Table C-4. With three values for each five parameter, ice index could be calculated for 35 = 243 combinations. Doubtful environmental data combinations were excluded so that only the reasonable combinations were in use for ship speed calculations by NEWSIM2 code, yielding the ship speed corresponding to the ice index.