丂
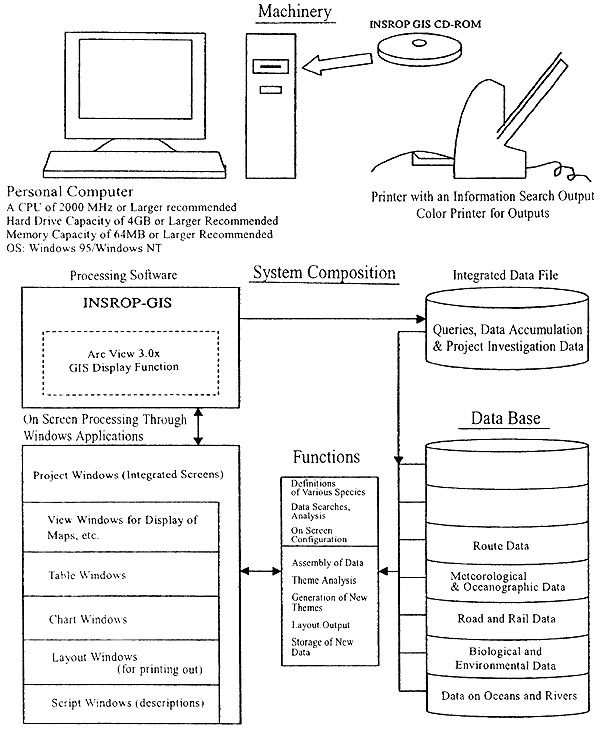
Table 4.6-1 is a list of the data currently registered in INSROP GIS. An example of data display is shown in Figure 4.6-2, for average ice thickness in January around the NSR.
The topics in the database and their data sets are as follows.
[1] Map data
This data serves as the basis for display of various data. A broad map is prepared, sweeping from northern Europe through Siberia to the Far East.
[2] Ice data
These data, provided mainly by AARI, were compiled separately in several forms, and so consist of the following three types of data source:
1. Point data on ice conditions throughout a wide area of the Arctic Ocean: Satellite data from the last 20 years are divided into 25-square-kilometer segments.