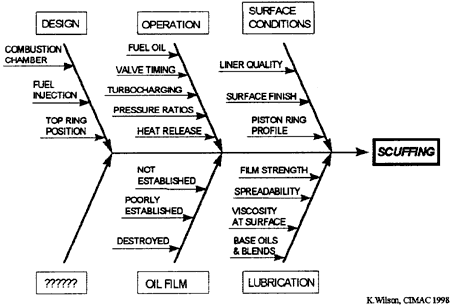
The reasons for scuffing to occur are generally extremely complex. According to Wilson [15] many parameters can play a role, which can be related to engine design, operating parameters and hardware surface conditions, while also the lube oil and its film quality can be involved. For instance, the roughness of the liner and ring surfaces will have an influence on the load at which metal-to-metal contact starts and the rougher the surfaces the lower the onset load. Other important elements are the presence of water in the scavenge air, that may replace the oil film on the liner, and the combustion characteristics of the fuel. In the latter case one may expect a slow burning fuel to bum away the oil film from the liner surface, which may result in an immediate case of scuffing. Also additional unknown parameters may be involved as is illustrated in Wilson's so-called 'fish-bone' diagram in Figure 8.
Figure 8. Overview of Possible Causes of Scuffing

The positive effect of the lube oil in preventing scuffing can be both in the formation of an oil film of sufficient thickness at peak temperatures over the entire liner surface (i. e. lube oil viscosity, lube oil viscosity index, lube oil spreadability, lube oil quantity, etc.) as well as in the inherent load carrying capability of the lube oil. It is required that the lubricant provides protection both under the largely hydrodynamic lubrication conditions of the mid-stroke travel path of the rings as well as during the boundary lubrication period that prevails when the piston ting slows down to full stop at top position around which time the maximum combustion pressure starts to exert extreme forces on the back of the ring. A better quality oil will provide a larger safety margin against scuffing when one or more of the other parameters tums borderline. To qualitatively assess the effectiveness with which an oil is capable to prevent metal-to-metal contact a laboratory test procedure has been developed to study in particular the extreme boundary lubrication regime at top-dead-centre of the top ting. This test has been found to give very satisfactory agreement with (so far limited) knowledge of field experience.
5.1 Laboratory Test Procedure
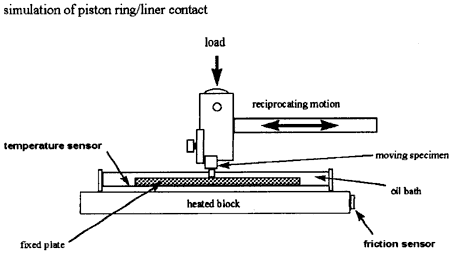
The test is based upon the well-known Cameron-Plint TE-77 pin-on-plate friction and wear testing machine in which a moving specimen is reciprocated against a stationary plate to simulate piston top position under closely controlled conditions. As test specimen a steel plate of closely specified hardness and surface finish and a pin finely machined from a 2-stroke engine piston ring (Bolnes DNL 190/600) were selected. The plate is immersed in the test oil on a heated block that is gradually raised in temperature up to a maximum of 350℃. The very high specific load applied on the pin, equivalent to some 500 bar, and the moving frequency are kept constant throughout this test. The resulting friction force as well as the contact potential and the maximum wear depth at the contact area are continuously monitored following a precise running-in procedure. The test set-up is schematically shown in Figure 9.
Figure 9. Schematic Drawing of Cameron-Plint Test Set-up

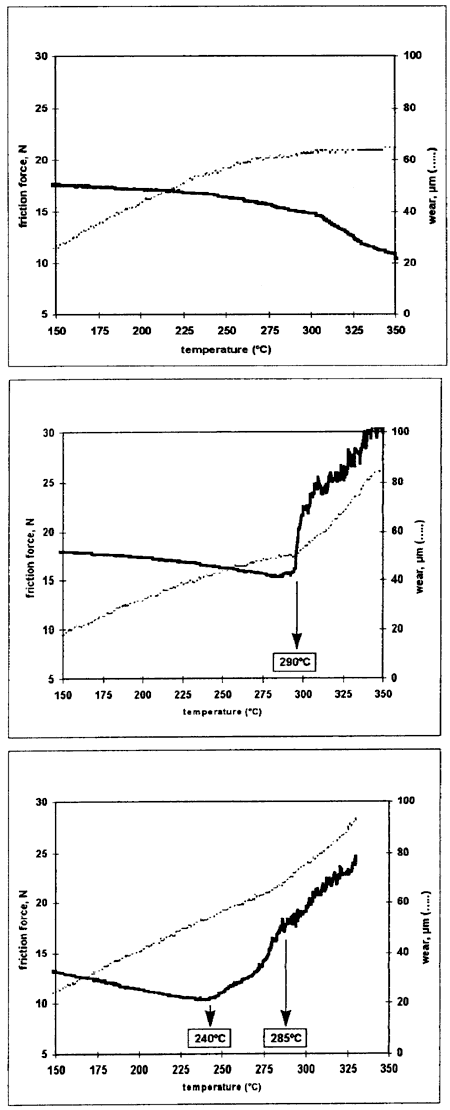
Depending on the load carrying capacity of the oil, at a certain temperature during the testing sequence the friction force may start to increase sharply indicating less stable operation. This loss of friction control has been interpreted to represent the occurrence of metal-to-metal contact under boundary lubrication conditions. With few exceptions, this inflection point closely coincides with an evenly sudden increase in the wear rate. In some cases, however, the loss of friction control precedes the increase in wear rate and then the former was chosen to represent the initial collapse of the oil film. Generally good reproducibility is observed in these two test parameters. The contact potential, on the other hand, has been found to be less reliable in defining the oil failure point and has been ignored. Typical examples of test traces of which two indicate a film fail temperature well below 350℃ are shown in Figure 10. Note that also Lim[16] has recently reported the use of a very similar testing procedure to assess the load carrying capacity of cylinder oils.
Figure 10. Typical Examples of Friction Force and Wear Development Traces

BACK CONTENTS NEXT