While the Weibull distribution is selected due to the flexibility of the determination of the parameter that can well described the failure pattern of the data that might be laid either on useful life period or wear out period.
The input of the failure modeling is the random variable T that represents the time to failure of the diesel engines. Time to failure here defined the time elapsed by the (actively operated) diesel engines between two interrupted operations due to the diesel failed to operate.
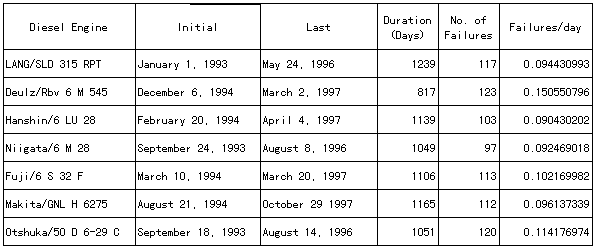
Due to the limitation of the available data as the consequences of ships were bought as used-ship, then only the newest data recorded on ships were used as a basis of analysis. In order to the data could be categorized into one of the three regions in the bath up curve, then the data were collected at least at the interval of one complete cycle operation, i.e. at least between two overhauls. Table 2 shows the period of data collection, number of failures occurred during those intervals and also failure rate of each diesel engine calculated using empirical formula, that is, simply by dividing the duration of the diesel engine in operation with the number of failures during its period.
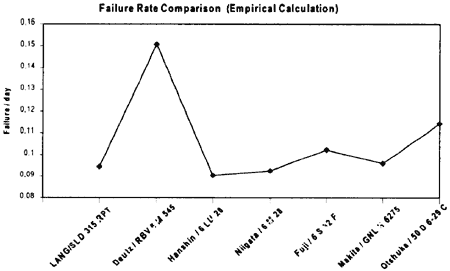
Fig. 3 shows the comparison of the failure rate, which are calculated using simple calculations, among analyzed diesel engines. The value of the number of failures per day range between 0.090430202 to O.150550796. DEUTZ/RBV 6 M545 has the highest number of failures per day. It is not a surprisingly since it was installed onboard ship in 1972. The surprise result was showed by LANG/SLD 315 RPT diesel engine that has the number failures per day 0.094430993. It is because the engine was installed onboard ship since 1972. This result is closed to the one indicated by MAKITA /GNL H 6275, that is 0.096137339 failures per day. MAKITA /GNL H 6275 was installed onboard ship since 1983, which is relatively new compared with LANG/SLD 315 RPT. OTSHUKA/50D6-29 diesel engines has relatively high number failures per day, that is 0.114176974. It is also considered as a surprise result, since the engine is the newest engine among the analyzed diesel engines. Hanshin/6 LU 28 has the smallest failure rate, that is, 0.090430202 failures/day.
Table 2 The period of data collection

Remark
The data collection was started when the D/E was operated for the first time after overhauied and teminated when the D/E was overthauied again at the dock

Fig. 3 The comparison of number of failures per day
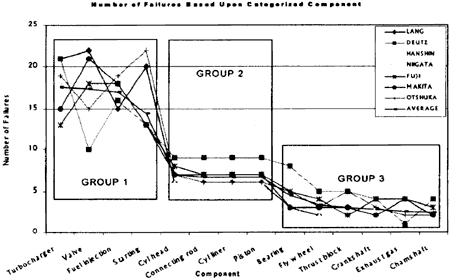
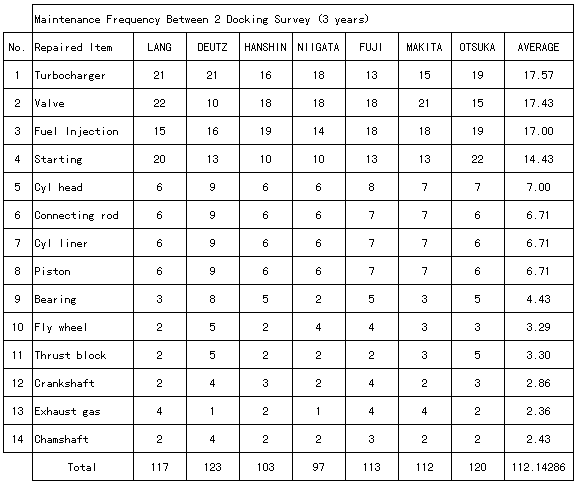
Table 3 shows the number of failures for each diesel engine based upon categorized components. While Fig. 4 shows the graphical representation of number of failures of them and also the average of each diesel engines. The number of failures of categorized item for each diesel engine seems to be distributed in the same way. The reasonable explanation of these might be because all diesel engines almost have the similar specifications as presented in table 1.
From the table and the graph, it is seen the number of failures for all components of all diesel engines almost have the same patterns. The failure patterns showed in Fig. 4 are then categorized into three groups based upon their number of failures, started from the largest one to the smallest one. Group 1 includes turbocharger, valve, fuel injection, and starting unit. Group 2 consists of cylinder head, connecting rod, cylinder liner, and piston. Group 3 comprises bearing, flywheel, thrust block, crankshaft, exhaust gas, and camshaft.
Categorizing the group based upon their number of failures, other regular patterns are also obtained. Group 1 contains the upper parts of diesel engines. Group 2 consists of parts around the cylinders and pistons of the diesel engines, while group 3 covers lower parts of the diesel engines except for exhaust gas unit and camshaft.
Table 3 Number of failures based upon categorized component


Fig. 4 The comparison of number of failures per day of categorized component of the diesel engines
The input of failure modeling of each diesel engine is time to failure recorded based upon maintenance record written in each log book of diesel engine. The distributions utilized to model the failures are exponential distribution, Weibull distribution, and normal distribution as discussed in section 3. A set of the TTF data of each engine are modeled into all distributions mentioned above. The parameters for each distribution are determined by using MLE method. PC-based software was used to speed up the calculation for obtaining the parameters. The distributions resulted from a set of diesel engine's TTF data are then compared to choose the fittest one based upon the value ofthe MLE. Table 4 shows the results of the analysis explained above. The best value of MLE, which represents the fittest distribution, for each set of TTF data is highlighted.
BACK CONTENTS NEXT