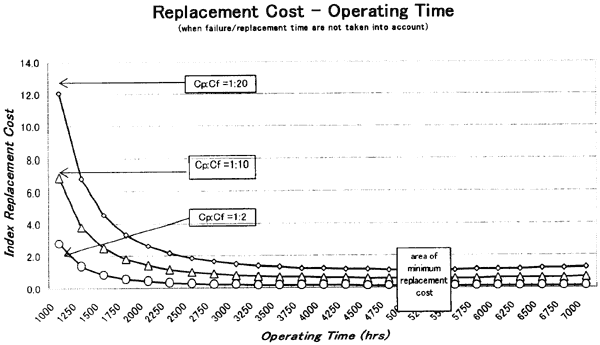
Fig. 5 Replacement cost-operating time I
丂
Likewise, it is also directed to determine the significance of each variable (Cf, Cp) to the optimum expected replacement cost.
Some manipulations are also performed, by varying the ratio between time to take the failure replacement (Tf) and time to take the preventive replacement (Tp). This is also intended to find the significance of Tp and Tf to the optimum expected replacement cost.
Figure 5. (Seawater Cooling Pump/SWCP) shows the replacement cost-operating time diagram when failure/replacement time are not taken into account. For various ratios between Cp: Cf, it clearly figured how significant the cost of failure replacement is, in determining the total replacement cost. It can also be seen that the range of 5000 hours to the 5500 hours of operating time is the best period in conducting replacement, since it gives the lowest index of the replacement cost.
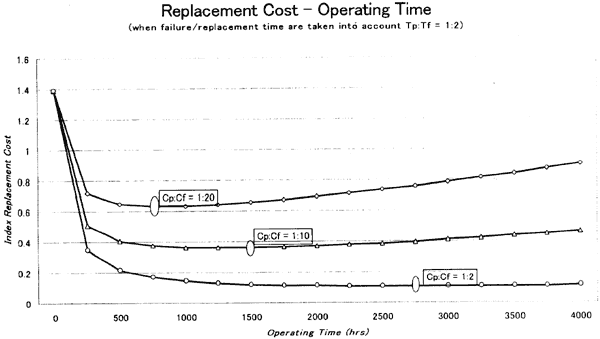
When failure/replacement time is taken into account, as shown in Figure 6, then the bigger the ratio Cp/Cf, the bigger the possibility to shift to the left direction. The magnitude of the shifting is dependent upon either the ratio Tp: Tf or the ratio Cp: Cf
Moreover, an increase in the ratio between Cp: Cf results in the increase of the interval between the two replacements. It means that it is better to have a small ratio between Cp:Cf in selecting a component from two or more available components, since it gives the possibility to reduce the total expected replacement cost per unit operation time. However, apart from this first analysis the process in determining the Cp and Cf, would be more significant in order to find a precise conclusion.
It is also obviously seen that the increase of the reliability index will reduce the total expected replacement cost per unit time. In other words, for a fixed replacement cost, then the component, which has higher reliability index, would have a wider range of the replacement 500 time.
When the time required for failure and preventive replacement are taken into account, or in other word, if the replacement time significantly effects the total operation of the components, then some interesting features can be drawn. For a component having a different ratio between the time required for preventive replacement (Tp) and the time required for failure replacement (Tf), then the bigger the ratio, the smaller the range between two replacement, for a fix ratio of Cp: Cf. It shows the significance of well determined replacement time.
For a fix Tp: Tf then the bigger the ratio, the longer the range between two replacement. It also consistent with the first case that the better a component in terms of its reliability index, the lower its expected replacement cost, for a fix operation time.
Again, as the first analysis, attention must be paid in determining the value of Tf and Tp since it is quite sensitive in producing the exact optimum expected replacement cost, especially when comparing two components of similar reliability index.
丂
5. Concept on The Use of Multiple Criteria Decision Making (MCDM) for Marine Machinery Selection
丂
5.1. Backgrounds
In the decision making process the use of the Multiple Criteria Decision-Making (MCDM) process has been widely used. (Ref. 10-16). The use of this process in marine machinery selection in particular, is a part of the objectives of the research in which the authors are interested. The description below summarized the progress of the pre-study, which explained the concept of the research process. What has been explained on the previous section, obviously, was just a part of the consideration in marine machinery selection process. The whole scheme of the selection process can be seen in Fig. 7.
Reliability, which is the main consideration on this paper, eventually will be one of the considerations to be taken into account for the whole machinery selection scheme.
丂
Fig. 6 Replacement cost-operating time II