It is clearly expressed by the constant failure rate.
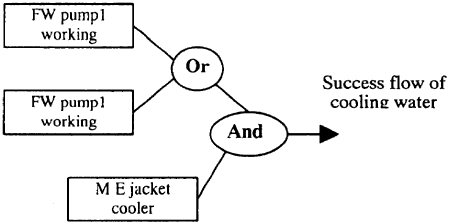
Assessing the reliability of the main engine cooling system, modeling of the system by use of the logic diagram, will be the second important step after carefully understanding the behavior of each component. The use of logic diagram gives a clearer picture of the combination between input, alternative paths, and output as shown in Figure 1 as an example.

Fig. 1 Logic Diagram
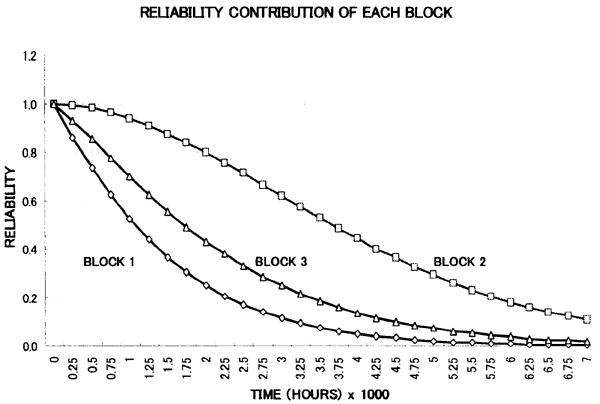
By deducting the logic diagram for the whole components within the main engine cooling system, 3 (three) groups of components were obtained, as shown in Table 1. Adopting the reliability index of the component as obtained in [6] eventually gives the effect of each group of components to the total system reliability as shown in Figure 2.
Table 1. Group of components

Figure 2 shows that block 1 has the minimum reliability and has certainly became the weakest part in terms of system reliability roficiency. At a glance, it is quite reasonable, since group 1 is the group that is directly affected by the seawater. Further evaluation can be delivered by means of the criticality analysis of each component, which is described later.
3. Component Importance
A further verification process on the component's importance to the whole system reliability can be very useful in reliability evaluation. It will provide information to the engineer as well as the designer and repair person about the component identification which will increase the system reliability the most or vice versa9).
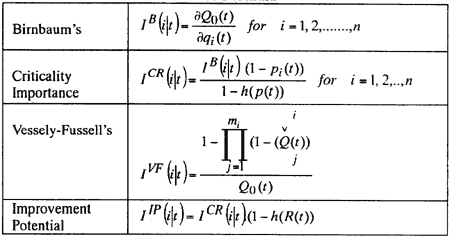
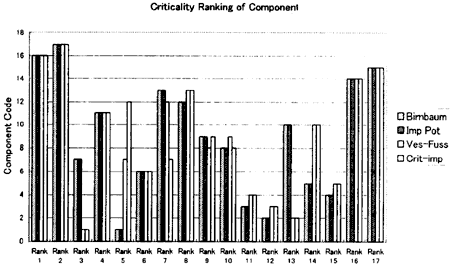
In this particular evaluation of the main engine cooling system, several methods are applied with the basic aim to verify the results by comparing each to another. Those methods are Birnbaum's Measure, Criticality Importance, Vessely-Fussell's Measure and Improvement Potential. Logical procedure and mathematical concepts of those evaluations can be referred to reference 9.4 (four) associated basic formulas are shown in Table 2 and the result is shown in Figure 3.

Fig. 2 Reliability Contribution of Each Group
Table 2. Component Importance Formula


Fig. 3 Criticality ranking
As shown in Figure 3, the result of the Birnbaum Measure shows the same pattern as one obtained by the Improvement Potential. It is obvious since they use the same logical calculation. However the Vesely-Fussell and Criticality Importance show a result which is inconsistent with the two former methods. As many textbooks suggested, however, in the case of identification of the component that should be improved to increase system reliability, the use of the Birnbaum Measure and. Improvement Potential would be more appropriate. On the other hand, to identify the components that have the largest probability of being the cause of system failure, the Vesely-Fussell and Criticality Importance would be the most appropriate.
BACK CONTENTS NEXT