Fig. 6 Ratio of each error mode on 499 major failures on 1993 - 1998
Fig.6 shows the ratio of each human error mode for the total of all 499 major failures reported for 1993 - 1998. Here, omission error accounts for 48%, commission error 48%, and imperfection error 4%. There is not so big deferent ratio between omission error and commission error for these 499 major failures. It is assumed that ship crews will have behaviors of omitting necessary work process and behavior of failing in work process with same percentage.
Fig.7 shows ratio of each error mode for these 499 cases of major failure during 1993 - 1998 together with the failed machinery and parts of main diesel engine. Although the ratio of omission error (omitting or forgetting a work process) is high for cams and camshaft driving system, main diesel engine combustion chambers and turbochargers as well as shafting equipment have almost same ratio with respect to commission error (failed in work process) as omission error.
On the other hand, it is supposed that the failures on machinery in engine room are caused by not only human errors but also constructive defect such as degradation of machinery due to wear and tear, corrosion, fatigue crack, for example, which can not be found by daily or periodical checking or maintenance, may be related to these failures mostly. In order to find some evidence of relationship between human errors and constructive defects, analysis was conducted using Weibull Distribution.
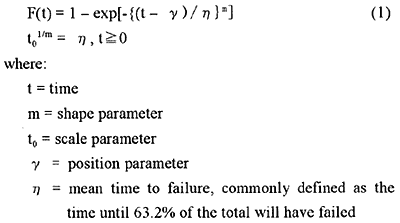
The cumulative failure rate F(t), or the percentage of the total samples which can be expected to fail before a certain time t, can be derived from the following formula[3].[4];

In a Weibull Distribution, the failure mode, which can generally be recognized by a large or small value for the shape parameter in the above formula (1), provides a good guide when examining the cause of failures and malfunctions, as follows;
m < 1: decreasing failure rate, initial failure type
m = 1: constant failure rate, random failure type
m > 1: increasing failure rate, wear-out failure type
For example, it has been reported that the shape parameter, m, of marine diesel engine components is around 1.0, Hence, for example m = 0.6〜1.5 in case of fuel injection valves, m = 0.9〜1.8 in the case of exhaust valves, and m = 0.9〜1.6 in the case of starting valves [4].
It is also recognized that accident or failure caused by human error will be occurred randomly, and it may be recognized that the failure caused by some defects on construction of machinery, system or management etc. will have decreasing failure rate for new ships and increasing failure rate for old ships. Fig.8 shows cumulative failure rates of each piece of machinery or main engine part which were calculated using data on 499 major failures assuming that a total of 300 ships from 0 to 20 years of age would be navigating yearly. Shape parameter of each Weibull distribution in Fig.8 can be obtained in Table 1.