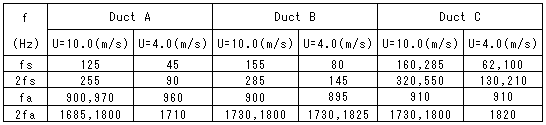
Table 1 Spectral Peaks for Duct A, Duct B and Duct C
丂
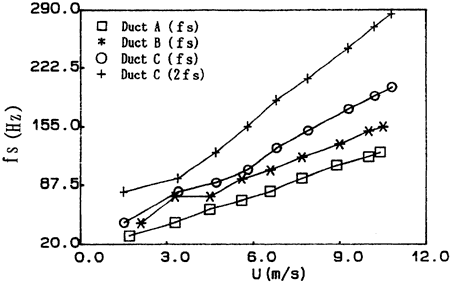
Fig. 4 Vortex-shedding Frequencies (fs) as a Function of Velocity (U)
丂
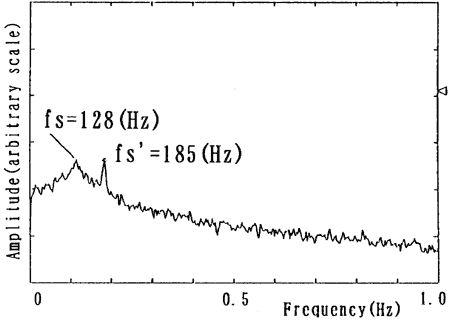
Fig. 5 Typical Turbulence Spectra Measured Behind the First Row in Duct C
丂
Table 1 summarizes the tube spacing tested (Duct. A, Duct B and Duct C) and the frequency at the vortex shedding (fs, 2fs) and the acoustical frequency (fa, 2fa). The transverse acoustical natural frequencies (fa, 2fa) of the duct with tube arrays in-stalled, i.e., natural frequencies of acoustical modes transverse to both the tube axis and the direction of flow, ranged from about 900 Hz in the first mode and 1800 Hz in the second mode. The acoustical natural frequencies of these modes are intermediate between the acoustical modes calculated without tubes and those calculated for a duct completely filled with tubes. The higher solidity tube arrays have the lower frequencies owing to the decrease in sound speed with increasing tubes array density.
The results of Duct A, Duct B and Duct C, obtained from the sound pressure spectra measured behind the first row, are summarized in Fig. 4. In Fig. 4, the frequencies of the flow periodicities are given. These data points correspond to the peak in the spectrum of the sound pressure at each velocity and the frequency of that peak. At first, the dominant frequency of sound increases linearly with approach velocity (U), according to the Strouhal relationship:
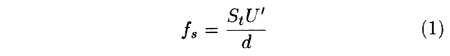
where St is the Strouhal number and fs is the shedding frequency, non-dimensionalized by the tube diameter d and gap velocity U'. For rows and arrays of tubes or cylinders, U' is defined as the average flow velocity through the minimum area (gap) between the cylinders. For the arrays in these tests, the minimum gap velocity is related to the velocity in the free area of the duct:
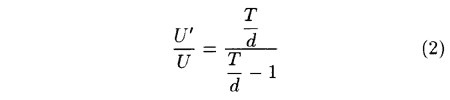
where T is the transverse distance between tube centers. These peaks are therefore associated with organized flow periodicities at the Strouhal numbers: St = 0.17 for Duct A, St = 0.23 for Duct B, Sf = 0.23, 0.37 for Duct C. Closely spaced tubes with a tube array do not permit formation of a classical von Karman vortex street, but the flow visualizations of Ziada and Oengoren [3] demonstrate that discrete vortices are periodically shed in the shear layers behind tubes in closely spaced tube bundles.
丂
丂
丂
BACK丂丂丂CONTENTS丂丂丂NEXT
丂