Table 3. Computed Propeller Torque and Thrust Amplitudes and Phases
Table 4. Measured Propeller Torque and Thrust Amplitudes and Phases
丂
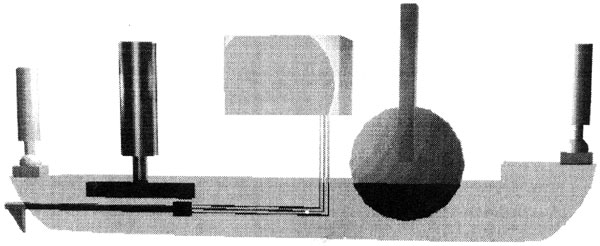
The torque and thrust fluctuations were determinate in a cavitations tunnel with a propeller dynamometer in the measurement section 850x850 mm. The data from this device may be digitally read and automatically recorded by a printer; the whole measurement set-up device is shown in Figure 7.
Table 4 presents the measurements results, transposed at real scale. Figure 9 shows a comparison between computations and experiments. The differences are included in Bureau Veritas limits [12], according to the 16-th International Towing Tank Conference. The main conclusion carried-out is that this analytical second method is a good predictive one for the marine propeller excitations induced in the engine shafting system, due to the acceptable agreement with experiment performed on scaled models, as shown in Table 5.
A first observation that could be made is that measurements do not show a perfect reproduction of torque and thrust over intervals corresponding to the period of blade motion specified by (26). These variations are caused mainly by the random character of the wake distribution.
The Fourier analysis of these functions was performed over a complete revolution of the propeller shaft and it was found that the dominant harmonic components are still the multiple of the blade number. These components, expressed in relation to the blade frequency, are listed in Table 4.
In order to compare calculations with experiments, torque and thrust relative fluctuations have been calculated according to:
丂
丂
The mean effective values are M0 = 1019.7932 kNm and T0 = 1378.6397kN. These relative values are listed, together with the ones recommended by the Classifications Society Bureau Veritas [6], in table 5. A comparison of these data shows an acceptable agreement between calculations and experiments, both complying with the requirements.
As far as the harmonic structure is concerned, the dominant component corresponds to the first order at blade frequency, i.c. the Z=4-th order at shaft frequency. The ratio between the magnitudes of the first and second harmonic components (at blade frequency) and the mean value of the torque and, respectively), thrust are given in Table 6.
丂
Fig. 8 Towing Tank Schedule.