3. RESULTS AND DISCUSSION
丂
3.1 Water-Coalescence inside Droplet
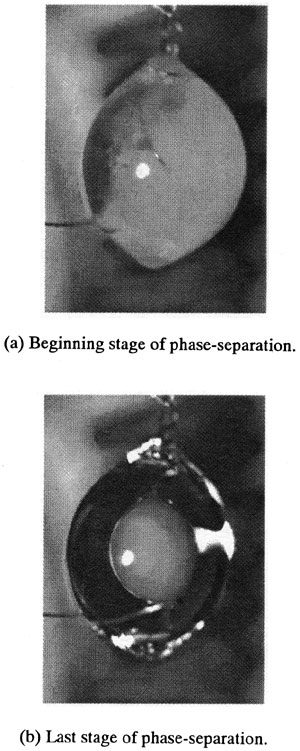
Figure 4 shows an example of the magnified images of an emulsion droplet, which is heated up and burns under microgravity. The initial water content cw is 0.1. The droplet is opaque and uniformly milky-white before droplet-heating. As shown in Fig. 4(a), transparent region appears at the side surface of the droplet and the phase-separation starts after heating starts. The progress of the phase-separation results in the formation of an opaque and milky-white region at the center of the droplet. Figure 4(b) corresponds to the last stage of the phase-separation. The milky-white region is spheroidal and enveloped by a transparent layer; An internal milky-white droplet is formed inside the primary droplet at its center.
This phase-separation was also observed under the normal gravity, and it has been found that the dominant components of the internal droplet and the outer layer are water and the base fuel, respectively [14: However, the behavior of the phase-separation was rather different; The phase-separation was largely promoted by the internal flow under the normal gravity. On the other hand, the internal flow was scarcely observed in the present study. This implies that the phase-separation of water and the base fuel occurs mainly due to an increase in the droplet temperature, which induces agglomeration and coalescence of water and the base fuel, as well as drainage of water. The internal water-based droplet would be formed at the center of the primary droplet by surface tension under microgravity.
Figure 5 shows an example of the time history of the droplet temperature. The initial water content cw is 0.1. The abscissa represents the lapse of time from the start of droplet-heating. The instants of the start and the end of the phase-separation, and the instants of ignition and disruptive microexplosion are also pointed on the temperature curve in Fig. 5. It is evident that the droplet temperature increases monotonically with the lapse of time. There is no drastic change in the temperature curve around the phase-separation. The temporal variations of the droplet temperature for the initial water contents of 0.2 and 0.3 were almost the same as the initial water content of 0.1, as shown in Fig. 5.
Figure 6 shows the effect of the initial water content on the droplet temperatures, at the start and the end of the phase-separation, and right before the microexplosion. This figure represents the averages and the ranges of the temperatures measured twice in the microgravity experiments. It is obvious that the droplet temperatures at the start and the end of the phase-separation are almost independent of the initial water content.
丂
Fig. 4 Phase-separation in emulsion droplet under microgravity.
Fig. 5 Time history of droplet temperature.
Fig. 6 Droplet temperature at start and end of phase-separation and at microexplosion.