As indicated in figure 2, along with the increase in the mixing ratio the benzenoid substances in the oils lessen. Figure 3 shows an increasing evaporation rate of the oils in respect to temperature as the mixing ratio increases. The analytical result from a GC-Mass spectrometer, illustrated in figure 4, proves that the blended oil is similar to WPD.
Table 1: C. Oil Properties
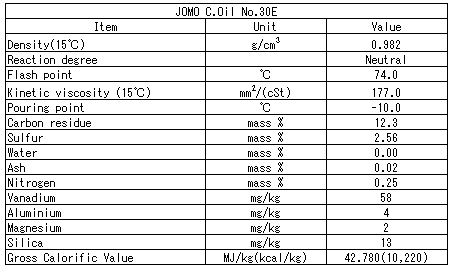
Table 2: WPD Properties
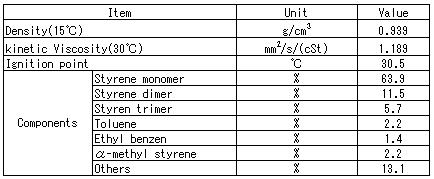
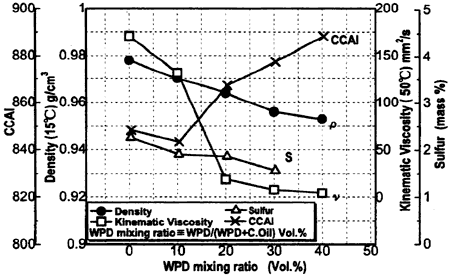
Fig. 1: Change in CCAI, Kinematic Viscosity, Desity and Sulfur Content of Experimental Oils
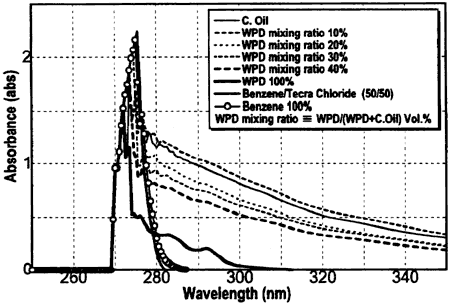
Fig. 2: UV absorbency of Experimental Oils
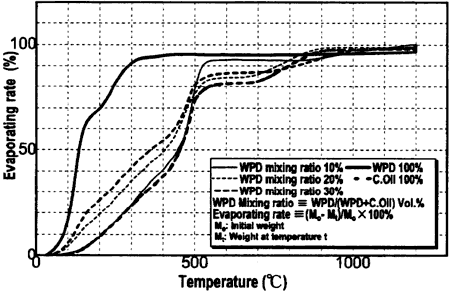
Fig. 3: Evaporation Rate of Experimental Oils
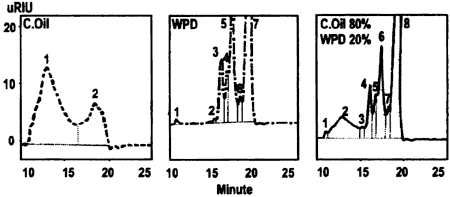
Fig. 4: Analysis by GC-Mass spectrometer of Experimental Oils
3. EXPERIMENTAL METHODS AND EQUIPMENTS
Table 3 states the specifications of the engine used for the experiment and figure 5 illustrates the experimental schematic diagram. The concentration of NOx, SO2, CO2, O2, NO and emission rate of PMS were measured. NOx concentration was measured with a chemiluminescent analyzer (NOA-305A, Shimazu), O2 concentration with a paramagnetic detector (POT-101. Shimadzu), CO2, NO2, CO with a constant potential electric detector (Testo 33) and SO2 with an infrared-ray analyzer (URA-107). PMs were sampled on a glass-fiber filter at the rate of 60 liters of gas per filter.
BACK CONTENTS NEXT