Species diversity and coverage of coral communities during ecological succession in the Ishigaki-jima, southwestern Japan
Toru Nakamori1) and Kaoru Sugihara2)
1) Institute of Geology and Paleontology, Graduate School of Science, Tohoku University, Japan. 2) Department of Earth System Science, Faculty of Science, Fukuoka University, Japan
Changes in species diversity of coral communities during ecological succession are reconstructed on the basis of species richness (S) / community coverage (A) plots obtained by quadrat (1 x 1 m2) method on the reef flat of the Ishigaki-jima, southwestern Japan. The species richness of the Acropora formosa community is around 0 where the coverages are almost 0, and increases with an increasing coverage. It reaches 9 species, the highest number among the study areas when the coverages are from 30 to 40%. Then, the richness decreases gently toward 2 or 1 species until the coverages reach 60 %. The S/A curve of another Montipora digitata community from the same locality indicates similar pattern as that of A. formosa community. In other words, the species diversity starting from 0 might attains to it's climax of the succession halfway, and finally decreases due to monopolization by superior species in competition, if it can be postulated that the coverages of the communities keep on increasing as time passes. This hypothesis is supported by the fact that the Pielou's Equitability Index is decreasing with an increasing coverage.
Dynamic model of the species richness and the coverage during the succession is proposed here. Changes in species richness (S) is defined as a sum of rates of increasing richness (Sin) by invasion of new species into a quadrat and decreasing richness (Sout) by extinction of some species within the quadrat;

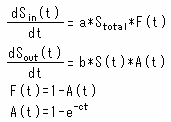
where t is time (year) passed from an initiation of area (1 m2). Each rate can be calculated as follows;

where a, b, and c are constants and Stotal is the maximum number of the coral species appeared in this area. A(t) and F(t) are areas (m2) covered with corals and without corals, respectively. Solution trajectory to these differential equations was drawn by the Runge-Kutta Methods with initial conditions of A(0)=0, A(∞)=1, and S(0)=0, and with constant values of a=0.05, b=1, c=0.1 and Stotal=100. Richness curve which shows it's maximum (10 species) at 5 years and converges to several species within a duration longer than 20 years was obtained. The similarity of the curve to the actual data strongly suggests that the model reflects the real processes occurred in the coral reef ecosystem.