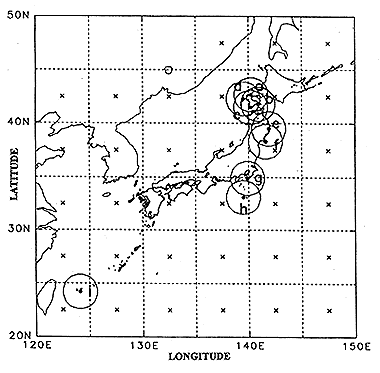
Fig.1. Locations of 9 coastal sea surface temperature(CSST)stations used in the present study.Stations are as follows:Suttsu(a),Shiokubi(b),Shirakamisaki(c),Inahozaki(d),Miyako(e),Enoshima(f),Nojimazaki(g),Hachijyojima(h),and Ishigakijima(i).Circles surrounding CSST stations denote the areas where SST data are extracted for comparison from COADS and the Kobe Collection.Symbols of cross(x)attached to every 5 x 5 degrees denote the grid points where correction values are given by Folland and Parker(1995).
The data period treated is from the beginning of archives(1854 for COADS and 1890 for the Kobe Collection)to 1997.First,we set the circular area with the radius of 200km surrounding each CSST station(see Fig.1)and extract the raw SST data from the above two data sets,and then monthly mean values are computed.At this stage,to discard the outliers and erroneous ones of the raw data,we calculate the standard deviations for each calendar month using the raw data of the whole period,and the raw data exceeding two times of standard deviation are discarded.Finally,we update monthly values only when tha number of raw data is greater than 5 in each month.
(c) Bucket correction by Folland and Parker(1995)
Here we briefly introduce the correction proposed by Folland and Parker(1995)to historical SST data based on the ship reports,and its adoption to the present SST data set.Since SST data in the bucket method are measured on the ship deck using the stem thermometer inserted in the bucket,readings of SST are influenced by the heat exchange through the side and bottom walls of the bucket as well as water surface during the measuring work.