Here, we discuss the change of NOx values due to the change of the setting values of pmax/pme and/or ps/pme under the derating of the engine in the layout diagram with the same fuel injection system and with the same configuration of the combustion chamber. In this case, it is easily understood that the average max. temperature in cylinder Tmax correspond well to the max. local flame temperature. Therefore, in the following discussion, we adopt the Tmax instead of the max. local flame temperature.
At first, the change of Tmax was examined in the different setting values of pmax/pme and ps/pme under the derating of the engine from the max. MCR point L1 with constant revolution no. Regarding the C type engine belong to the group II, the following 3 cases of the calculations of Tmax were executed by means of the performance simulation analysis according to the already mentioned matching method.
Case 1: pmax and ps/pme constant (pmax/pme increase)
Case 2: ps and pmax/pme constant (ps/pme increase)
Case 3: pmax constant, ps/pme little bit increase (pmax/pme increase, the slope of ps/pme against pme/pme0 is -0.1)
Here, the performance simulation analysis means the computer calculation method as follows. The gas conditions in the cylinder are calculated at every minute crank angle according to First low of the thermodynamics by using the given heat release ratio and by considering the heat loss. Then the fuel injection timing is arranged by the repeated conversion calculations to make the obtained value of pmax coincide with the given value. As for the exhausting and scavenging process, the calculation is carried out under assumption of the ratio of the perfect mixing scavenging and the perfect stratified scavenging being 0.5 : 0.5. Further, the calculations of the work balance of the turbocharger, the heat and mass balance for the exhausting and scavenging process, and etc. are executed.
Fig.5 shows the calculation results. Figure (a) in this figure show the setting conditions of pmax/pme. The pmax/pme in case 1 and case 3 increase in inversely proportional to the decrease of pme/pme0 and that in case 2 is kept constant. Also, figure (b) shows the setting conditions of ps/pme. The ps/pme in case 2 increase in inversely proportional to the decrease of pme/pme0 and that in case 1 is kept constant, whereas that in case 3, where the slope of ps/pme against pme/pme0 is set as -0.1, goes into midway among former two cases.
Figure (c) and (d) shows the change of V1/VH and V2/VH according to the already mentioned matching method. In both cases, these values in case 1 and case 3 decrease and those in case 2 increase along with the decrease of pme/pme0.
Figure (e) shows the change of Tmax/Tmax0 determined by the above mentioned parameters changes. As seen from this figure, the Tmax/Tmax0 in case 1, where the pmax/pme increase under the constant ps/pme, increase considerably along with the decrease of pme/pme0. On the other hand, the Tmax/Tmax0 in case 2, where ps/pme increase under the constant pmax/pme, decrease considerably along with the decrease of pme/pme0. However, in case 3 where the pmax/pme increase and at the same time ps/pme increase gradually with its slope against pme/pme0 of -0.1, Tmax/Tmax0 is remained as almost constant.
Also, figure (f) shows the change of the thermal efficiency ηth/ηth0. As seen from this figure, case 1 increase and case 2 decrease considerably along with the decrease of pme/pme0, whereas case 3 is sufficiently improved by decreasing pme/pme0 although it dose not amount to case 1.
Therefore, in case of the derating of the engine where pme/pme0 is lowered under the constant revolution and with the constant pmax to obtain higher thermal efficiency, if ps/pme is set as its slope against pme/pme0 being -0.1, it is possible to get almost max. thermal efficiency gain under the constant cylinder temperature condition which assure the reliability of engine.
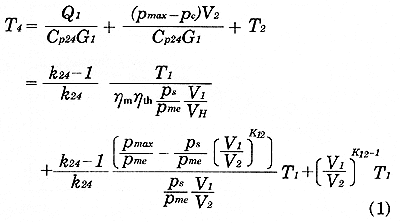
In order to show easily the effect of each performance parameter to the Tmax, we examine here the max. temperature in Sabathe cycle T4 (the temperature at the end of constant pressure combustion). T4 is shown as bellow.

It is seen from this equation that T4 is given by summation of the three kinds of temperatures. That is, the first term temperature in the right hand side of this equation is obtained by dividing the input heat quantity by the gas heat capacity at the beginning of compression. The second term temperature is given by dividing the gas technical work from point 2 to 4 by the same heat capacity as before. The third term temperature T2 is that at the end of the compression process.
According to the eq. (1), the followings can be said.
In case 1, the second term increase by the increase of pmax/pme, also the first and second terms increase by the decrease of gas quantity G1 due to the decrease of V1/VH, furthermore the third term also increase due to the increase of the compression ratio ε, consequently T4 inecrease totally in spite of the decrease of the first and the second term due to the increase of ηth and ε.