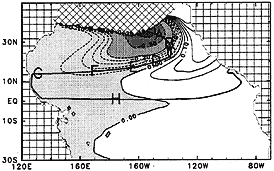
Figure 6:丂Tracer concentration on 冃兤=25.5 surface at the 5th year. Contour intervals are 0.05 for -0.25 to 0.25. Negative values are dashed and shaded.
丂
4-2.丂TRANSIENT VARIATION
The period of the 乬delayed action oscillation,乭 is determined by the time scale to transport the temperature anomaly from the North Paciflc to the equator (Gu and Philander 1997). In addition to a purely advective time scale determined by current velocity only, the isopycnal mixing introduces other time scales as well.
To show the movement of this subducted tracer front, we plot the time-distance development of the time derivative of the tracer concentration along the trajectory shown in Fig.6 (Fig.5a).
The front of the tracer subducted from the sea surface moves with the water parcel, along the straight line, from point A and decays rapidly up to point D. The time scale of this subducted water parcel to arrive at the equatorial region is about 15 years and after which the tracer field approaches a steady state. A remarkable feature of Fig. 5a is a sudden rapid increase in tracer concentration around year 5, point F. This concentration front is then advected to the equatorial region. It is this tracer that, first arrives at the equatorial region around 10th year, well before the water parcel advected from point A does.