In this paper, I provide a brief overview of the relevant HOT observations, and show the pronounced freshening signal in the upper pycnocline which has been captured. The large-scale context for this signalis discussed, including the ocean circulation and surface forcing. Two hypotheses about the source of this signal are presented and discussed, and preliminary conclusions are drawn.
丂
OBSERVATIONS
丂
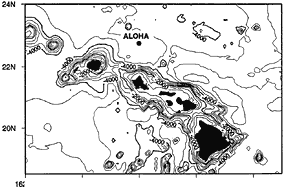
The HOT deepwater site (Station Aloha) is at 22亱45'N, 158亱W, in approximately 4800m of water (Fig. 1). Approximately 10 occupations of the site were made each year from October, 1988 through August, 1998. Station visits last about 3 days, and they include 36 hours of 3-hourly CTD 乬burst乭 sampling over the upper 1000m, needed to average out the energetic baroclinic tides (Chiswell, 1994). Shipboard acoustic Doppler current profile (ADCP) measurements have been made on many of these cruises (Firing, 1996). Many other measurements are made during each cruise; see Karl and Lukas (1996) for acomprehensive description of the measurements and data processing.
Other observations that are used in this study include wind stress, evaporation and heat fluxes from the NCEP reanalysis (Kalnay et al., 1996), and the CMAP rainfall dataset (Xie and Arkin, 1997).
丂
Figure 1.丂Bathymetric map of the Hawaiian Islands showing the location of the Hawaii Ocean Timeseries Station ALOHA. Isobaths are every 500m.
丂
THE FRESHENING SIGNAL
丂
Fig. 2 shows the time series of salinity in the upper 1000 dbar, both in pressure and in potential density coordinates. Note that baroclinic tides and other relatively high frequency internal waves have been averaged out of the data of each cruise before plotting, but the pressure coordinate presentation still exhibits coherent vertical displacements of the mean salinity structure. The potential density framework clearly filters out such salinity variations which are due to energetic low frequency baroclinic waves (cf. Chiswell, 1996; Mitchum, 1996).
The salinity maximum of the Subtropical Underwater (STUW; O'Connor et al., 1998) occurs between about 50m and 200m (24 to 25 冃兤), but it occasionaily appears to surface, such as in 1993 and in 1998. Also shown are deviations from the mean and annual cycle computed from the HOT observations (Bingham and Lukas, 1996). Variations of salinity on an isopycnal surface, such as seen in Fig. 2d, can only be due to along-isopycnal advection or to diapycnal mixing.
A pronounced salinity decrease of 乣0.15 psu is observed in the upper pycnocline between 1991-97. This trend can be more clearly seen in the time series of average salinity in the 24.2-25 冃兤 layer (Fig. 3, top). Note the change in the sign of the trend beginning in 1998. This signal is also observed in the mid-pycnocline (25-26 冃兤, Fig. 3, bottom), however the trend reversal occurs later than in the shallower layer, and the magnitude is smaller.