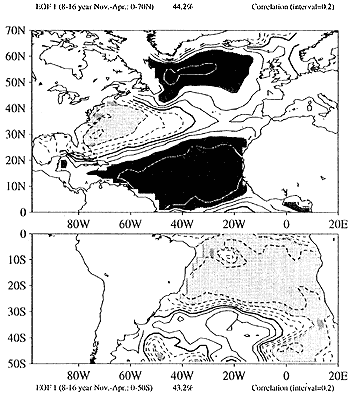
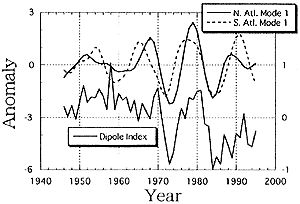
Figure 2پ@The first EOFs for the North and the South Atlantic, which explain 44.2% and 43.2% of decadal SST anomalies (8-16 years). Positive (negative) values are represented by solid (dashed) lines. The upper two curves in the bottom panel present the principal component (PC) of the North (solid line) and South (dashed line) Atlantic EOFs. The lowermost curve presents the dipole index.