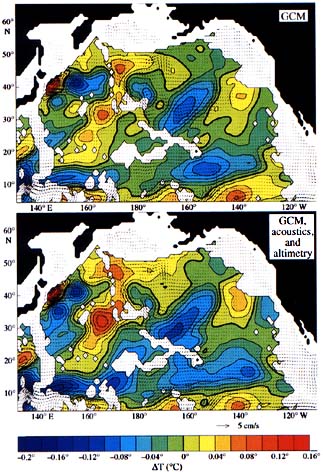
日本財団 図書館


192-1.jpg

Figure 4. The upper panel depicts the GCM-predicted temperature change, averaged over the top 4000m, from January 1996 to January 1997. The arrows indicate the corresponding change in velocity at 610m. White regions indicate depths less than 4000m in the GCM. The lower panel depicts the same quantities, but after combination of the GCM with the acoustic and altimetric data. The data require significant changes in what the GCM alone computes.


192-2.jpg

Figure 5. Heat content change inside the region spanned by the acoustic array (inner box in Fig. 1) as predicted by the GCM (blue line) and by the GCM-altimeter-acoustic combination (red line and associated error bar). The results have been converted to an equivalent sea surface heat flux per unit area for comparison with estimates from the NCEP (black line). The difference between the NCEP and the GCM-altimeter-acoustic estimates (dashed line) indicates the advective component at the lateral boundaries of the region or errors in either or both of the atmospheric or oceanic fields.


BACK   CONTENTS   NEXT


日本財団図書館は、日本財団が運営しています。

  • 日本財団 THE NIPPON FOUNDATION