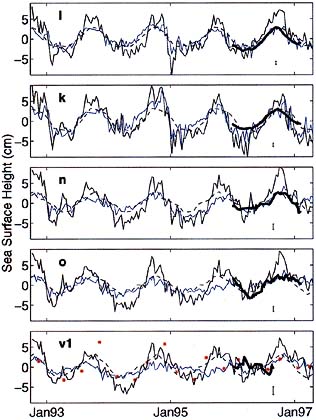
Figure 3.پ@The range-averaged sea level anomaly along the acoustic sections inferred by several independent methods: (i) thick black lines indicate the ATOC acoustic measurements converted to equivalent sea surface height for comparison with the altimeter data, (ii) thin black lines are from the TOPEX/POSEIDON altimeter data, (iii) dashed lines represent the climatologicai thermal anomaly converted to sea surface height, (iv) blue lines are the GCM estimates, and (v) the asterisks along sectron v1 are the XBT data. Uncertainties are indicated for the acoustic estimates: the possible errors are largest along section v1 owing to a lack of surface reflecting rays near the receiver.
پ@
COMPARISON OF THE DATA
پ@
Each of the measurement types„ںacoustic, altimetric, and XBT„ںcan be used to produce an estimate of components of the sea level anomaly, ƒإacoust,ƒإaltim, and ƒإXBT, respectively, over all or part of the domain. The available climate estimate, ƒإclim, is restricted to the mean seasonal cycle.15 Another estimate, ƒإGCM, comes from the GCM.
The altimetric and GCM records roughly track the climatological annual cycle, albeit with different amplitudes (Table 1) and with obvious evidence of both higher frequency and interannual variability. Acoustic results also track ƒإclim for all sections except v1, but they do not exhibit the short period fluctuations of ƒإaltm and ƒإGCM. Differences betweeƒإaltim and ƒإacoust (2.4cm rms) result from salt and barotropic contributions to ƒإ present in ƒإaltim as well as from uncertainties in the altimetric and acoustic estimates.