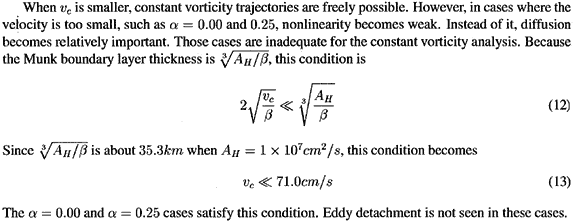
Figure 9 shows constant vorticity trajectories superimposed on the model domain for (a) νc = 110cm/s (corresponding to the α = 1.00 case) and (b) 200cm/s (the α = 2.00) respectively. β = 2.28 × 10⁻¹³cm-1s-1 is used.
In fact, Figure 9(a) and Figure 7 have good correspondence. All trajectories in Fig. 9(a) do not cross topography. Therefore, these trajectories are possible. Figure 9(a) shows that some constant vorticity trajectories loop back on itself. Therefore, these trajectories are unstable. Thus, tilting of a eddy because of Rossby wave propagation causes eddy detachment like Fig. 7.

When νc = 200cm/s corresponding to the α = 2.00 case (Fig. 9(b)), trajectories fully cross the topography. Therefore, constant vorticity trajectories which retroflect back on itself are impossible. This explains why the MC became stable in the α = 2.00 case.

From the α = 0 = 1.50 case, the MC satisfies this condition and begins to collide with the Celebes island. Thus, the MC constantly and stably feeds transport through section B. This explains the jump of the transport across section B at α = 1.50.
6. Summary
1. The average total IT transport is hardly affected by the wind strength in the northern hemisphere, which supports Godfrey's (1989) Island Rule.
2. However, the transport through each strait does depend on the wind stress curl in the northern hemisphere or the strength of the MC. As the MC is strengthened, the water from the MC increases in the IT passing through the Makassar Strait.
3. With the increase of the wind stress curl in the southern hemisphere, the fraction of the water directly from the New Guinea Coastal Current expands in the IT (not shown here).