The forecasts that started on 1 Jan'98 and 1 Apr'98 did not capture the rapid warming that occurred during April/May. This was the case both with and without data assimilation. Also the forecasts started from the initial conditions using the FSU winds did not capture this rapid warming. The reason for this deficiency in the performance over this period is probably not related to errors in the initial conditions, since the forecasts show small sensitivity to the ocean initial conditions.
Forecasts from 1 Jul'97 under-predicted the El Nino peak by 0.5-1亷 for all sets of initial conditions. The forecasts from the assimilation initial conditions performed better for initial conditions starting on 1 Oct'97, however.
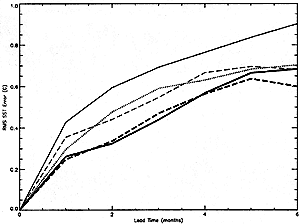
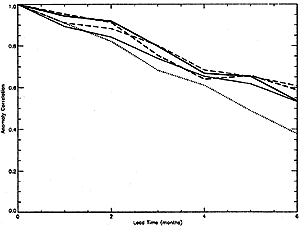
The rms errors for forecasts with start dates in the period 1991-1996 as a mean over the 5 member ensemble for the NlNO 3 region is shown in fig. 2a. In fig. 2b is the corresponding anomaly correlations. Forecasts startingin 1997 have been excluded from these statistics because the 1997/98 El Nino would mean that errors in this period are likely to be large and dominate the statistics. In terms of rms error the forecasts with data assimilation (fig. 2a), both A_ERA and A_FSU, perform significantly better than those without data assimilation, C_ERA and C_FSU. In fact those with data assimilation beat persistence at all lead times. The rms errors from both assimilations are similar, but forecasts from the control using FSU winds have rms errors similar to persistence and significantly less than those from the control forced with ERA/Ops Wind stresses. Even though the two controls with different wind forcing perform differently, the two assimilations have a similar performance indicating that data assimilation has overcome most of the differences in the initial states due to the different wind forcing, at least in terms of the mean NlNO 3 SST forecast statistics over the period considered.
Figure 2.丂(a) rms error (b) anomaly correlation for the forecasts from 1991-1996 (inclusive) averaged over the 5 member ensemble for the NlNO 3 region. Dotted - persistence, Thick-solid - A_ERA, thin-solid - C_ERA, thick-dash - A_FSU, thin-dash - C_FSU.
丂
In terms of anomaly correlation (fig. 2b), the forecasts with data assimilation are much better than persistence over all lead times. Also the forecasts without data assimilation beat persistence at lead times greater than 2 months. At short lead times (1-2 months) the forecasts from both data assimilation initial conditions are better than those without data assimilation. As for the rms error statistics, forecasts from the control with FSU wind forcing are better than those from the control with ERA/Ops forcing. Furthermore, forecasts initialised from the control with FSU wind forcing are as good as forecasts from both data assimilation initial conditions.