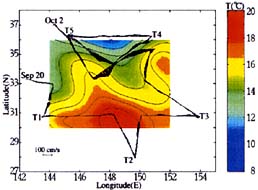
Figure 5.پ@Velocity vectors at 190m depth derived from the in situ shipboard ADCP measurements during the recovery cruise (from September 20 through October 2), superimposed on horizontal temperature field at 200m detemined from tne tomography measurement. Both of these show the meander of the Kuroshio Extension.
پ@
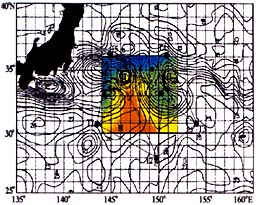
The contour map of sea surface dynamic heights (SSDH) constructed by JMA (Japan Meteorological Agency) from the T/P altimeterdata around the tomography site on July 28,, 1997 indicates an array of warm and cold eddies associated with the Kuroshio Extension meander Figure 6 [JMA, 1997; Yoshioka at JMA }, personal communication, 1998]. The positions of the warm and cold eddies (marked H and L, respectively) in the SSDH map are excellently coincident with those in the superimposed tomography map. The well developed warm eddy southeast of station T5 makes a remarkable warming of the water lying in the upper 400m between stations T2 and T5, as indicated with mark C in Figure 2(a).
Finally we discuss the temperature structure in a vertical section. The results of XCTD/CTD hydrocasts obtained on the transect T2-T5 during the deployment cruise agree roughly with those determined from the tomography measurements (see the solid lines in Figure 2(b)), while temperature differences of less than 2C exists in the whole section. Both of these show the Kuroshio front at a distance of 200km from station T5. The convex lens-shaped water mass and cold water mass located at 400m depth near 31ك N and station T5, respectively, are not resolvable in the tomography result. Note that the temperature field determined from the XCTD/CTD measurements was made during a 3-day interval (July 20-22, 1997) with a roughly 50-km horizontal resolution.
پ@